The Australian Dollar finished slightly better on Friday after giving up most of its earlier gains. Nonetheless, the currency had banked enough gains throughout the week to post its second straight positive week.
Supporting the Aussie were expectations of higher interest rates and booming commodity prices especially crude oil. The move reflects Australia’s status as an energy and commodities exporter. Rising expectations of an earlier than expected rate hike by the Reserve Bank of Australia (RBA) also underpinned the currency.
On Friday, the AUD/USD settled at .7516, up 0.0003 or +0.03%. The Invesco CurrencyShares Australian Dollar Trust ETF (FXA) closed at $74.44, down $0.07 or -0.10%.
After posting a solid gain early in the session, prices retreated as the AUD/USD neared its October 28, 2021 main top at .7556. The catalyst behind the profit-taking was a recovery in the U.S. Dollar. The greenback turned around after the 10-year Treasury yield hit a fresh two-year high Friday as investors anticipate a more aggressive Fed.
Daily Swing Chart Technical Analysis
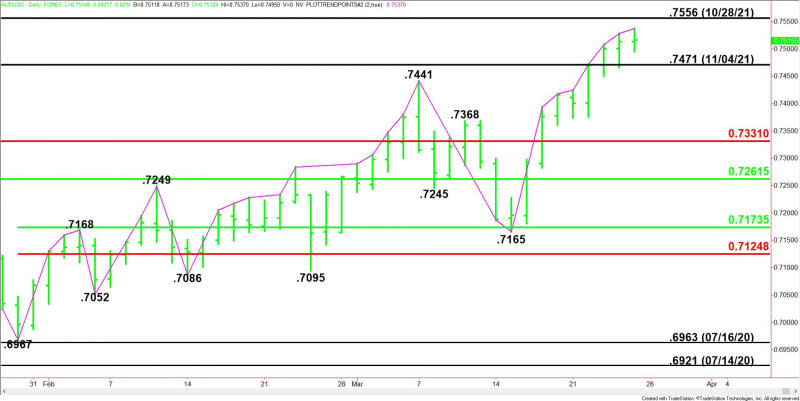
The main trend is up according to the daily swing chart. The uptrend was reaffirmed on Friday when buyers took out the previous high at .7528.
A trade through .7165 will change the main trend to down. This is highly unlikely, but due to the prolonged move in terms of price and time, the AUD/USD will begin Monday’s session inside the window of time for a potentially bearish closing price reversal top.
The nearest support is a long-term retracement zone at .7331 to .7261.
Short-Term Outlook
Taking out Friday’s high at .7537 will signal a resumption of the uptrend. If this move creates enough upside momentum then look for a test of .7556. This level is a potential trigger point for an acceleration to the upside.
A move through .7537 and a break below .7516 will signal the presence of sellers. If this generates enough downside momentum then look for a break into the former top at .7471. A failure to hold this level could trigger an acceleration to the downside. The move won’t represent a change in trend, but rather aggressive profit-taking.
Side Notes
A trade through .7537 and a close below .7516 will form a closing price reversal top. If this chart pattern is confirmed then look for the start of a minimum 2 to 3 day correction with .7331 the next likely target level.
For a look at all of today’s economic events, check out our economic calendar.
This article was originally posted on FX Empire


