What would you say if you were told about a company whose stock was trading much lower to expected earnings per share than the S&P 500 Index? At the same time, it’s also expected to increase EPS nearly three times as quickly as the benchmark index through 2023.
That would be Huntington Bancshares Inc. HBAN,
Some banks are better-positioned for rising interest rates than others. These banks are considered “asset sensitive,” because their loans are repricing more quickly than their deposits.
Comparison to S&P 500
The S&P 500 Index SPX,
That’s high, but it has fallen. Here’s a chart that shows the movement of the S&P 500’s forward P/E along with those of the Invesco KBW Bank ETF KBWB,
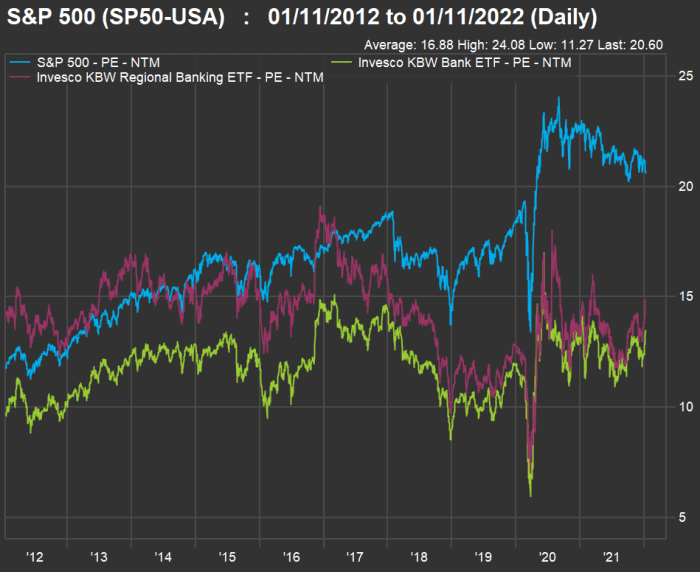
KBWB tracks the KBW Nasdaq Bank Index BKX,
KBWR tracks the KBW Nasdaq Regional Banking Index KRX,
As you can see on the chart, the two groups of banks trade lower than the S&P 500 Index on a forward P/E basis. They usually do. And while all three groups are trading above their 10-year average P/E, this effect is less pronounced for the banks:
| Ticker | Current forward P/E | 10-year average forward P/E | Current valuation to 10-year average | Current valuation to S&P 500 | 10-year average valuation to S&P 500 | |
| Invesco KBW Bank ETF | KBWB, |
13.53 | 11.89 | 114% | 66% | 70% |
| Invesco KBW Regional Banking ETF | KBWR, |
14.89 | 14.28 | 104% | 72% | 85% |
| S&P 500 Index | SPX, |
20.60 | 16.88 | 122% | ||
| Source: FactSet | ||||||
The larger banks as a group tend to trade at about 70% of the S&P 500’s forward P/E valuation. Even though KBWB has returned 38% over the past year, it is still trading a bit lower, relative to the S&P 500, than usual on this basis.
The same cannot be said for the smaller regional banks, with KBWR trading at 85% of the S&P 500’s forward P/E valuation — above its 10-year average of 72%.
In general, ETFs are a good way for investors to play sector trends. Then again, some banks are expected to increase their earnings more quickly than others as interest rates rise.
We’re now at the beginning of what may turn out to be a long cycle of rising interest rates as the Federal Reserve switches policy to fight inflation, after supporting the federal government’s efforts to spur economic growth during the coronavirus pandemic.
The Fed will end its extraordinary bond purchases in March, which will put further upward pressure on long-term interest rates. The central bank is also expected to increase short-term rates several times this year.
Rising interest-rate indexes mean banks will be able to increase the rates they charge on revolving credit lines. Commercial loans typically have relatively short terms and also tend to be renewed — these will reprice at higher rates, increasing banks’ profits. Meanwhile, banks as a group are awash with cash, which means they will have relatively little pressure to increase the rates they pay for deposits.
Screening the banks
Starting with a group of 76 banks — the 24 in the KBW Nasdaq Bank Index, the 50 in the KBW Nasdaq Regional Banking Index, plus Goldman Sachs and Morgan Stanley — we looked at consensus estimates for earnings per share from 2021 through 2023 to calculate a compound annual growth rate (CAGR) for the two years.
Stock analysts who work for brokerage firms have a tradition of basing their ratings and price targets on 12-month estimates. But in a note to clients on Jan. 11, Christopher Marinac, director of research at Janney Montgomery Scott, wrote that “the impact of rising interest rates is more likely to benefit banks in 2023 than 2022 due to the timing of Federal Reserve policy changes and the actual reset of banks’ loan portfolio and the deployment of excess cash and liquidity.”
So this is a two-year story, at least, while Wall Street’s ratings and price targets, and financial-media coverage, is generally geared to much shorter periods.
Among the 76 stocks in the screen, these 14 are expected to achieve 10% (rounding up) EPS CAGR or higher from 2021 through 2023:
| Bank | Ticker | City | Forward P/E | Two-year est. EPS CAGR | Est. EPS – 2021 | Est. EPS – 2022 | Est. EPS – 2023 |
| Cadence Bank | CADE, |
Tupelo, Mo. | 20.5 | 35.7% | $1.69 | $2.56 | $3.12 |
| Huntington Bancshares Incorporated | HBAN, |
Columbus, Ohio | 13.0 | 25.9% | $0.96 | $1.38 | $1.52 |
| Signature Bank | SBNY, |
New York | 21.2 | 23.9% | $14.67 | $17.60 | $22.53 |
| Eastern Bankshares, Inc. | EBC, |
Boston | 20.8 | 23.1% | $0.96 | $1.12 | $1.45 |
| State Street Corporation | STT, |
Boston | 12.7 | 18.2% | $7.32 | $8.51 | $10.23 |
| Bank of New York Mellon Corporation | BK, |
New York | 14.4 | 16.8% | $4.16 | $4.64 | $5.67 |
| Western Alliance Bancorp | WAL, |
Pheonix | 12.3 | 14.2% | $8.66 | $9.76 | $11.28 |
| Northern Trust Corporation | NTRS, |
Chicago | 17.6 | 13.6% | $7.08 | $7.66 | $9.13 |
| New York Community Bancorp, Inc. | NYCB, |
Hicksville, N.Y. | 10.9 | 13.5% | $1.21 | $1.25 | $1.56 |
| First Republic Bank | FRC, |
San Francisco | 25.6 | 11.9% | $7.58 | $8.25 | $9.48 |
| Webster Financial Corporation | WBS, |
Waterbury, Conn. | 13.5 | 11.7% | $4.58 | $5.04 | $5.71 |
| Valley National Bancorp | VLY, |
New York | 12.5 | 10.9% | $1.15 | $1.21 | $1.41 |
| First Bancorp | FBP, |
San Juan, Puerto Rico | 11.8 | 10.3% | $1.30 | $1.39 | $1.58 |
| Truist Financial Corporation | TFC, |
Charlotte, N.C. | 14.7 | 9.7% | $4.55 | $4.63 | $5.47 |
| Source: FactSet | |||||||
You can click on the tickers for more about each company.
Then read Tomi Kilgore’s detailed guide to the wealth of information available for free on the MarketWatch quote page.
In comparison to the banks on the list, the S&P 500 is expected to have an EPS CAGR of 9.4% from 2021 through 2023, according to weighted aggregate consensus estimates compiled by FactSet.
To be sure, a bank may have made the list because analysts believe its loan and deposit pricing mix is set up to take particular advantage of rising interest rates. But a rapid grower may also have made the list.
Here’s the list again, with dividend yields and a summary of opinion among analysts polled by FactSet:
| Bank | Ticker | Dividend yield | Share “buy” ratings | Closing price – Jan. 10 | Cons. price target | Implied 12-month upside potential |
| Cadence Bank | CADE, |
2.38% | 72.73% | $33.61 | $36.50 | 8% |
| Huntington Bancshares Incorporated | HBAN, |
3.64% | 42.11% | $17.03 | $18.03 | 6% |
| Signature Bank | SBNY, |
0.63% | 94.44% | $353.24 | $388.00 | 9% |
| Eastern Bankshares, Inc. | EBC, |
1.48% | 83.33% | $21.60 | $24.50 | 12% |
| State Street Corporation | STT, |
2.25% | 61.11% | $101.20 | $115.93 | 13% |
| Bank of New York Mellon Corporation | BK, |
2.17% | 57.89% | $62.80 | $67.47 | 7% |
| Western Alliance Bancorp | WAL, |
1.20% | 92.31% | $117.08 | $144.15 | 19% |
| Northern Trust Corporation | NTRS, |
2.17% | 44.44% | $129.25 | $137.81 | 6% |
| New York Community Bancorp, Inc. | NYCB, |
5.18% | 57.14% | $13.12 | $15.44 | 15% |
| First Republic Bank | FRC, |
0.43% | 34.78% | $202.47 | $225.10 | 10% |
| Webster Financial Corporation | WBS, |
2.51% | 80.00% | $63.74 | $67.44 | 5% |
| Valley National Bancorp | VLY, |
3.00% | 62.50% | $14.67 | $15.88 | 8% |
| First Bancorp | FBP, |
2.54% | 100.00% | $15.73 | $17.00 | 7% |
| Truist Financial Corporation | TFC, |
2.94% | 48.00% | $65.29 | $68.24 | 4% |
| Source: FactSet | ||||||
Even for banks that are favored by analysts, the price targets may not seem aggressive. Then again, the targets only look out one year, and the rising-rate trend may take many years to play out.
More stock screens for the rising-rate environment:


