Semiconductor stocks haven’t risen in a straight line this year, but they have recovered from their last dip in May. Now the group is expected to maintain its head of steam through 2022 with faster growth than the broader stock market. But chip makers as a group trade below the broad indexes on a price-to-earnings basis.
Below is a list of the 10 semiconductor companies expected to increase sales the most through 2023.
Investors are paying close attention to this important technology subsector amid continuing shortages that are affecting many industries and presumably helping pricing for the chipmakers. For example, on Aug. 2, shares of ON Semiconductor Corp. ON,
ON CEO Hassane El-Khoury said there’s accelerating demand in “strategic automotive and industrial end-markets.”
Semiconductor performance and valuation
To set the stage, check out this chart showing total returns for the iShares Semiconductor ETF SOXX,
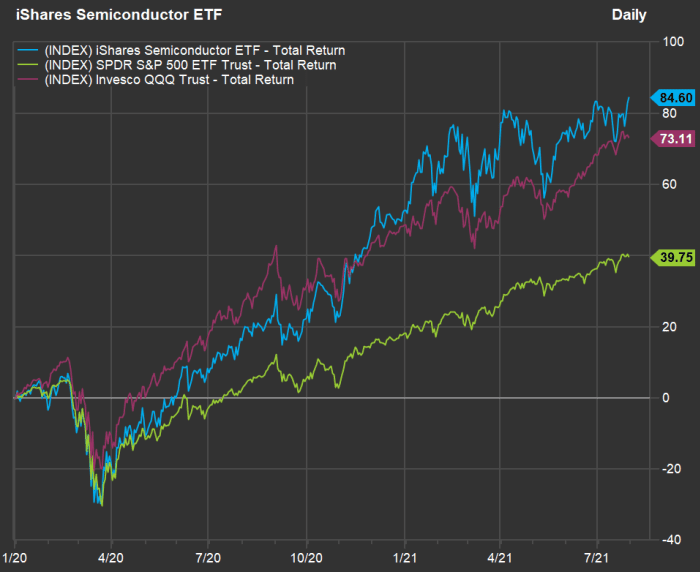
SOXX holds 30 stocks of the largest U.S.-listed semiconductor manufacturers and companies that make specialized equipment used by chip makers. The ETF is concentrated, with Nvidia Corp. NVDA,
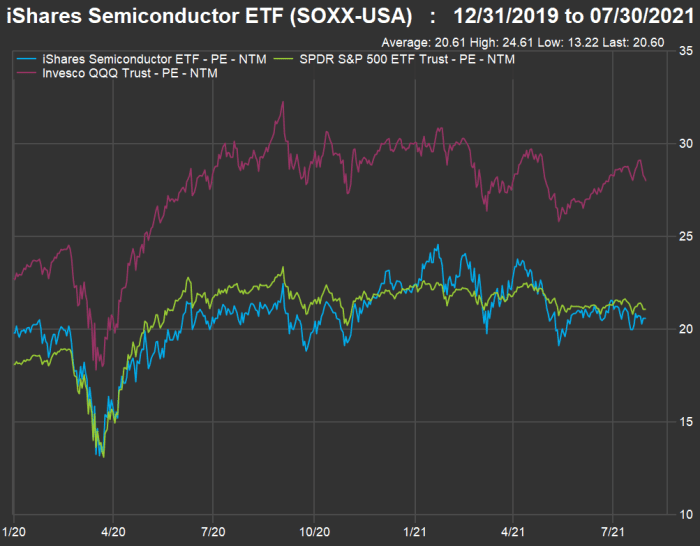
That type of performance would lead investors to expect SOXX to trade higher on a price-to-earnings basis than the broader market, but this isn’t the case. Here’s how forward P/E ratios have moved on a rolling 12-month basis since the end of 2019:
Now let’s look at projected growth rates for sales, earnings per share and free cash flow per share for SOXX, SPX and QQQ through 2023, based on consensus estimates among analysts polled by FactSet.
First, sales:
| ETF | Expected sales increase – 2023 | Expected sales increase – 2022 | Expected sales increase – 2021 |
| iShares Semiconductor ETF | 4% | 9% | 27% |
| SPDR S&P 500 ETF Trust | 5% | 6% | 14% |
| Invesco QQQ Trust | 10% | 10% | 20% |
| Source: FactSet | |||
The semiconductor group is expected to lead for sales growth during a banner 2021 and rank slightly behind QQQ in 2022. The projected sales-growth rate for QQQ is much lower for 2023, but that is pretty far out, considering how much sales (and sales estimates) have increased this year.
Here are growth projections for EPS:
| ETF | Expected EPS increase – 2023 | Expected EPS increase – 2022 | Expected EPS increase – 2021 |
| iShares Semiconductor ETF | -2% | 12% | 40% |
| SPDR S&P 500 ETF Trust | 9% | 9% | 45% |
| Invesco QQQ Trust | 8% | 11% | 38% |
| Source: FactSet | |||
For EPS, the semiconductor group is expected to remain in the lead through next year, before cooling off in 2023.
Here are growth estimates for free cash flow per share:
| ETF | Expected FCF increase – 2023 | Expected FCF increase – 2022 | Expected FCF increase – 2021 |
| iShares Semiconductor ETF | -10% | 20% | 26% |
| SPDR S&P 500 ETF Trust | 9% | 15% | 42% |
| Invesco QQQ Trust | 10% | 15% | 30% |
| Source: FactSet | |||
These are excellent numbers across the board for 2021 and 2022, with the semiconductor group expected to slow during 2023.
Fast-sales growers in the SOXX group
Now let’s look at projected compound annual growth rates (CAGR) for SOXX. Here are the 10 semiconductor companies expected by analysts to show the best three-year sales CAGR through calendar 2023, for which the underlying estimates are available (the sales numbers are in millions of dollars):
| Company | Three-year expected sales CAGR | Estimated sales – 2023 | Estimated sales – 2022 | Estimated sales – 2021 | Estimated sales – 2020 |
| Advanced Micro Devices Inc. AMD, |
27.6% | $20,260 | $17,986 | $15,433 | $9,763 |
| Marvell Technology Inc. MRVL, |
24.5% | $5,693 | $4,965 | $4,116 | $2,947 |
| Universal Display Corp. OLED, |
23.5% | $808 | $680 | $560 | $429 |
| Nvidia Corp. NVDA, |
23.2% | $30,253 | $27,138 | $24,180 | $16,189 |
| Monolithic Power Systems Inc. MPWR, |
23.0% | $1,573 | $1,354 | $1,168 | $844 |
| Cree Inc. CREE, |
17.5% | $1,242 | $864 | $660 | $765 |
| ASML Holding NV ADR ASML, |
17.5% | $27,371 | $25,346 | $22,147 | $16,886 |
| Taiwan Semiconductor Manufacturing Co. Ltd. ADR TSM, |
17.2% | $77,004 | $65,528 | $56,365 | $47,860 |
| Qualcomm Inc. QCOM, |
14.8% | $37,057 | $36,781 | $33,853 | $24,520 |
| Lam Research Corp. LRCX, |
14.6% | $18,600 | $17,900 | $16,119 | $12,368 |
| Source: FactSet | |||||
The sales numbers for 2020 are “estimated” because some companies’ fiscal periods don’t match the calendar.
Note that estimates for calendar 2023 aren’t yet available for five of the SOXX companies, including Micron Technology Inc. MU,
For Micron, analysts expect sales to increase to $38.46 billion in 2022 from an adjusted $23.53 billion in 2020, for a two-year CAGR of 27.9%. For Skyworks, analysts expect sales to grow to $5.87 billion in 2022 from an adjusted $3.8 billion in 2020, for a CAGR of 24.3%.
Leaving the projected sales-growth winners through 2023 in the same order and adding Micron and Skyworks, here are forward P/E ratios and a summary of analysts’ opinions about the stocks:
| Company | Forward P/E | Share “buy” ratings | Closing price – July 30 | Consensus price target | Implied 12-month upside potential |
| Advanced Micro Devices Inc. AMD, |
40.4 | 59% | $106.19 | $111.70 | 5% |
| Marvell Technology Inc. MRVL, |
40.8 | 79% | $60.51 | $60.88 | 1% |
| Universal Display Corp. OLED, |
55.1 | 71% | $234.49 | $258.17 | 10% |
| Nvidia Corp. NVDA, |
48.6 | 83% | $194.99 | $194.04 | 0% |
| Monolithic Power Systems Inc. MPWR, |
60.5 | 77% | $449.26 | $462.38 | 3% |
| Cree Inc. CREE, |
N/A | 29% | $92.76 | $114.69 | 24% |
| ASML Holding NV ADR ASML, |
41.5 | 73% | $766.74 | $797.78 | 4% |
| Taiwan Semiconductor Manufacturing Co. Ltd. ADR TSM, |
27.7 | 89% | $116.64 | $146.33 | 25% |
| Qualcomm Inc. QCOM, |
16.5 | 62% | $149.80 | $181.91 | 21% |
| Lam Research Corp. LRCX, |
19.0 | 73% | $637.41 | $746.90 | 17% |
| Micron Technology Inc. MU, |
7.3 | 88% | $77.58 | $120.55 | 55% |
| Skyworks Solutions Inc. SWKS, |
17.2 | 57% | $184.51 | $215.71 | 17% |
| Source: FactSet | |||||
The consensus price target for Nvidia is slightly lower than the closing price on July 30. So the analysts consider the stock to be fully valued. Then again, Wall Street is fixated on 12-month price targets — that’s actually a short period for committed long-term investors.
It’s also worth noting that Micron — one of the analysts’ favorites on the list — trades for a very low P/E.


