Semiconductor stocks have been hit hard, but many are poised for rapid growth. Here are 15 expected to shine through 2024
In December, we listed analysts’ favorite semiconductor stocks for 2022. That hasn’t turned out well.
But after chipmakers’ stocks have been hammered, the group is now trading at “normal-level valuations,” according to Matt Peron, director of research at Janus Henderson Investors. For long-term investors, it may help to see which companies in the sector are expected to grow most rapidly over the next two years.
Peron, in an interview, said one reason for this year’s decline for semiconductor stocks was that they had had a good, long run, stretching valuations. “Semiconductors are cyclical,” he said. In his role, Peron and his team provide advice to many portfolio managers, including those of the Janus Henderson Technology and Innovation Fund JATIX.
One of the biggest players, Intel Corp. INTC, will publish second-quarter results on July 28 after the market close. Here’s a preview.
Cheaper than the S&P 500
The stock-market benchmark for this corner of the technology sector is the PHLX Semiconductor Index SOX, which is made up of 30 stocks of U.S.-listed makers of computer chips and related manufacturing equipment and is tracked by the iShares Semiconductor ETF SOXX. This year’s action for SOXX looks ugly, when compared to the movement of the SPDR S&P 500 ETF SPY :
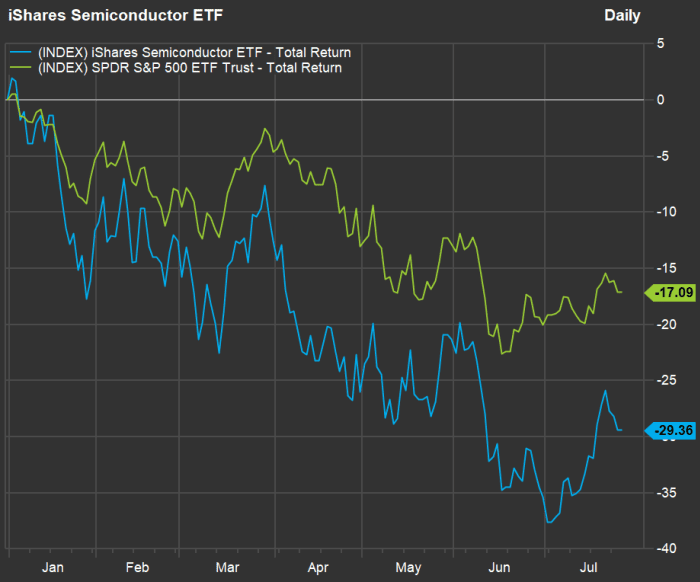
The iShares Semiconductor ETF has fallen much further than the SPDR S&P 500 ETF has during 2022.
FactSet
The above chart shows year-to-date total returns with dividends reinvested through July 26.
Peron said the bumpier ride for semiconductors resulted from “a combination of high valuations and, in part, the weight of the Federal Reserve coming down on the economy” with interest-rate increases to reduce inflation.
When asked about the chip shortage that has affected the auto industry and others, he said: “The demand can and will slow, given that there is a lot of inventory in the channel.”
Despite the semiconductor group’s greater volatility, it has performed much better than the benchmark has over long periods. Here are average annual returns:
| ETF | Average return – 3 years | Average return – 5 years | Average return – 10 years | Average return – 15 years |
| iShares Semiconductor ETF | 22.0% | 21.7% | 23.8% | 13.6% |
| SPDR S&P 500 ETF Trust | 10.8% | 11.5% | 13.3% | 8.8% |
| Source: FactSet | ||||
Now look at this year’s movement of forward price-to-earnings ratios, based on weighted rolling consensus 12-month earnings estimates for the two groups:
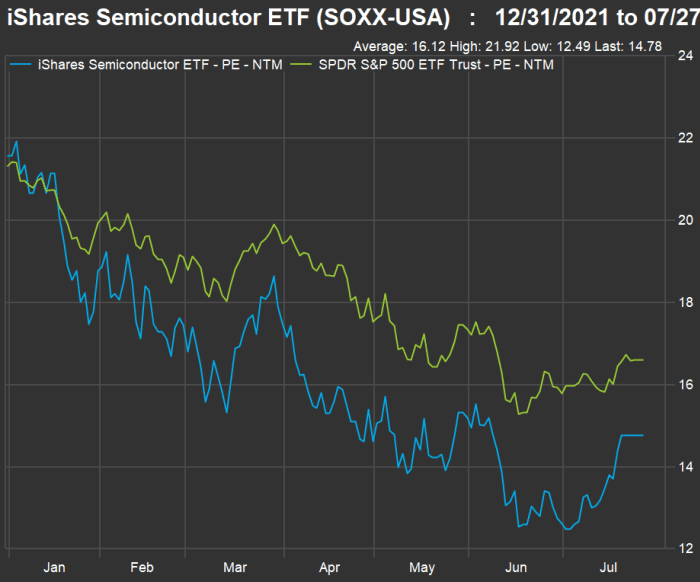
After beginning 2022 trading higher to forward earnings estimates than SPY did, SOXX now trades considerably lower than the benchmark.
FactSet
At the end of 2021, SOXX traded for 21.6 times expected earnings, slightly above SPY’s forward P/E of 21.3. But SOXX now trades at a forward P/E of 14.8, well below SPY’s forward P/E of 16.6.
Here’s a look at average P/E for the two groups over the past 10 years:
| ETF | Current forward P/E | 10-year average forward P/E | Current valuation to 10-year average | Current valuation to SPY | 10-year average valuation to SPY |
| iShares Semiconductor ETF | 14.78 | 16.55 | 89% | 89% | 98% |
| SPDR S&P 500 ETF Trust | 16.61 | 16.96 | 98% | ||
| Source: FactSet | |||||
The semiconductors as a group are trading at a greater discount to the S&P 500 than has been typical over the past 10 years.
“ For investors with two- or three-year horizons, semiconductors may be a good way to allocate capital .”
Should the chip makers be trading at a discount to the S&P 500? Here are projected compound annual growth rates (CAGR) for sales, earnings and free cash flow (FCF) per share for the two groups through 2024:
| ETF | Ticker | Expected sales CAGR – 2022 through 2024 | Expected EPS CAGR – 2022 through 2024 | Expected FCF CAGR – 2022 through 2024 |
| iShares Semiconductor ETF | SOXX | 9.0% | 6.9% | 10.2% |
| SPDR S&P 500 ETF Trust | SPY | 4.9% | 8.1% | 10.7% |
| Source: FactSet | ||||
The semiconductor group is expected to grow sales much more rapidly than the S&P 500. However, the full benchmark index is expected to show better earnings growth and a slightly better increase in free cash flow.
So the semiconductors as a group appear to be a mixed bag when considering their relatively cheap valuation to the S&P 500 and the two groups’ growth estimates. Let’s dig further into the semiconductor space.
Screening semiconductor stocks
For a broad screen of semiconductor stocks, we began with the SOXX 30 but then added companies in the S&P Composite 1500 Index XX:SP1500 (made up of the S&P 500 SPX, the S&P 400 Mid Cap Index MID and the S&P Small Cap 600 Index SML ) in the “Semiconductors and Semiconductor Equipment” Global Industrial Classification Standard (GICS) industry group.
We looked within the S&P Composite 1500 because it screens-out newer companies that haven’t achieved consistent profitability. Standard & Poor’s criteria for initial inclusion in the index includes positive earnings for the most recent quarter and for the sum of the most recent four quarters.
Our initial group included 56 companies, which we narrowed to the 37 for which consensus sales estimates were available through 2024 among at least five analysts polled by FactSet. We used calendar-year estimates — some of the companies have fiscal years that don’t match the calendar.
Here are the 15 companies are expected to achieve the highest sales CAGR from 2022 through 2024:
| Company | Ticker | Projected sales CAGR | Forward P/E | Forward P/E as of Dec. 31, 2021 | Market cap ($mil) |
| Wolfspeed Inc | WOLF | 36.8% | 347.7 | N/A | $9,414 |
| First Solar Inc. | FSLR | 28.8% | 54.9 | 44.2 | $7,841 |
| Enphase Energy Inc. | ENPH | 26.4% | 50.8 | 60.1 | $29,180 |
| SolarEdge Technologies Inc. | SEDG | 23.8% | 45.9 | 54.0 | $16,421 |
| Universal Display Corp. | OLED | 18.6% | 21.8 | 31.8 | $5,129 |
| SiTime Corp. | SITM | 17.9% | 35.6 | 85.3 | $3,556 |
| Marvell Technology Inc. | MRVL | 17.0% | 18.9 | 40.6 | $42,053 |
| SunPower Corp. | SPWR | 16.4% | 33.7 | 44.3 | $2,761 |
| Silicon Laboratories Inc. | SLAB | 16.3% | 34.9 | 89.7 | $5,068 |
| ASML Holding N.V. ADR | ASML | 16.1% | 29.4 | 41.2 | $213,062 |
| Nvidia Corp. | NVDA | 15.3% | 28.5 | 58.0 | $413,325 |
| Taiwan Semiconductor Manufacturing Co. Ltd. ADR | TSM | 14.6% | 13.4 | 24.3 | $437,809 |
| Teradyne Inc. | TER | 14.3% | 17.3 | 25.2 | $15,724 |
| Monolithic Power Systems Inc. | MPWR | 13.9% | 33.4 | 57.9 | $19,688 |
| Advanced Micro Devices Inc. | AMD | 13.4% | 18.7 | 43.1 | $138,148 |
| Source: FactSet | |||||
Click on the tickers for more about each company.
You should also read Tomi Kilgore’s detailed guide to the wealth of information for free on the MarketWatch quote page.
Small and mid-cap companies dominate the list. However, it also includes industry giants such as ASML Holding N.V. NL:ASML, Nvidia Corp. NVDA, Taiwan Semiconductor Manufacturing Co. TSM and Advanced Micro Devices Inc. AMD.
Forward P/E ratios can be very high for some of these companies, such as WolfSpeed Inc. WOLF, because of low near-term profit expectations. For the most part, the P/E ratios have declined considerably. A notable example is Nvidia, with a forward P/E of 28.5, compared with 58 at the end of 2021.
We have not included CAGR for EPS or FCF for the individual companies because low or negative numbers in the early periods can distort growth figures or make them impossible to calculate. So here are calendar-year EPS estimates and projected EPS CAGR for the group, if available:
| Company | Ticker | Estimated EPS – 2024 | Estimated EPS – 2023 | Estimated EPS – 2022 |
| Wolfspeed Inc | WOLF | $2.12 | $0.91 | -$0.24 |
| First Solar Inc. | FSLR | $4.21 | $2.13 | $0.29 |
| Enphase Energy Inc. | ENPH | $5.51 | $4.58 | $3.77 |
| SolarEdge Technologies Inc. | SEDG | $10.23 | $7.91 | $4.56 |
| Universal Display Corp. | OLED | $7.14 | $5.32 | $4.53 |
| SiTime Corp. | SITM | $5.30 | $5.06 | $4.35 |
| Marvell Technology Inc. | MRVL | $3.52 | $2.86 | $2.27 |
| SunPower Corp. | SPWR | $0.98 | $0.64 | $0.25 |
| Silicon Laboratories Inc. | SLAB | $5.33 | $4.22 | $3.63 |
| ASML Holding N.V. ADR | ASML | $24.05 | $20.29 | $14.51 |
| Nvidia Corp. | NVDA | $7.19 | $6.18 | $5.27 |
| Taiwan Semiconductor Manufacturing Co. Ltd. ADR | TSM | $7.44 | $6.41 | $6.13 |
| Teradyne Inc. | TER | $7.19 | $6.33 | $4.77 |
| Monolithic Power Systems Inc. | MPWR | $14.05 | $13.44 | $11.57 |
| Advanced Micro Devices Inc. | AMD | $5.92 | $4.77 | $4.31 |
| Source: FactSet | ||||
And FCF-per-share estimates:
| Company | Ticker | Estimated FCF – 2024 | Estimated FCF – 2023 | Estimated FCF – 2022 |
| Wolfspeed Inc | WOLF | $0.18 | -$2.21 | -$4.69 |
| First Solar Inc. | FSLR | $1.32 | $0.27 | -$6.48 |
| Enphase Energy Inc. | ENPH | $6.54 | $4.97 | $4.21 |
| SolarEdge Technologies Inc. | SEDG | $7.50 | $7.13 | -$0.01 |
| Universal Display Corp. | OLED | N/A | $5.53 | $4.54 |
| SiTime Corp. | SITM | N/A | N/A | N/A |
| Marvell Technology Inc. | MRVL | $3.05 | $2.55 | $2.01 |
| SunPower Corp. | SPWR | N/A | N/A | N/A |
| Silicon Laboratories Inc. | SLAB | $4.25 | $3.94 | $4.27 |
| ASML Holding N.V. ADR | ASML | $20.67 | $18.20 | $14.15 |
| Nvidia Corp. | NVDA | $5.93 | $6.12 | $4.59 |
| Taiwan Semiconductor Manufacturing Co. Ltd. ADR | TSM | $4.55 | $3.28 | $2.24 |
| Teradyne Inc. | TER | N/A | $6.33 | $3.69 |
| Monolithic Power Systems Inc. | MPWR | $12.91 | $10.52 | $8.35 |
| Advanced Micro Devices Inc. | AMD | $5.03 | $4.23 | $3.40 |
| Source: FactSet | ||||
Here is a summary of opinion among analysts polled by FactSet:
| Company | Ticker | Share “buy” ratings | Share neutral ratings | Share “sell” ratings | Closing price – July 26 | Consensus price target | Implied 12-2month upside potential |
| Wolfspeed Inc | WOLF | 56% | 33% | 11% | $76.14 | $102.38 | 34% |
| First Solar Inc. | FSLR | 25% | 62% | 13% | $73.57 | $79.44 | 8% |
| Enphase Energy Inc. | ENPH | 71% | 26% | 3% | $216.10 | $247.52 | 15% |
| SolarEdge Technologies Inc. | SEDG | 77% | 19% | 4% | $296.48 | $359.75 | 21% |
| Universal Display Corp. | OLED | 75% | 17% | 8% | $108.64 | $170.09 | 57% |
| SiTime Corp. | SITM | 100% | 0% | 0% | $169.02 | $263.00 | 56% |
| Marvell Technology Inc. | MRVL | 88% | 12% | 0% | $49.48 | $79.17 | 60% |
| SunPower Corp. | SPWR | 16% | 63% | 21% | $15.88 | $19.72 | 24% |
| Silicon Laboratories Inc. | SLAB | 42% | 58% | 0% | $138.54 | $162.89 | 18% |
| ASML Holding N.V. ADR | ASML | 79% | 15% | 6% | $524.17 | $628.71 | 20% |
| Nvidia Corp. | NVDA | 82% | 16% | 2% | $165.33 | $237.50 | 44% |
| Taiwan Semiconductor Manufacturing Co. Ltd. ADR | TSM | 92% | 8% | 0% | $84.42 | $115.36 | 37% |
| Teradyne Inc. | TER | 57% | 43% | 0% | $98.15 | $125.94 | 28% |
| Monolithic Power Systems Inc. | MPWR | 92% | 8% | 0% | $422.11 | $551.44 | 31% |
| Advanced Micro Devices Inc. | AMD | 68% | 29% | 3% | $85.25 | $125.76 | 48% |
| Source: FactSet | |||||||


