The Dow Jones Industrial Average’s selloff on Monday puts it on track to make it unanimous: All of the Big 3 market indexes have now produced the bearish pattern of lower lows and lower highs, suggesting the stock market may now officially be in a downtrend.
There are also those who suggest that despite the volatile movement, the market remains a bit too quiet for the current lows to be the last.
The Dow DJIA,
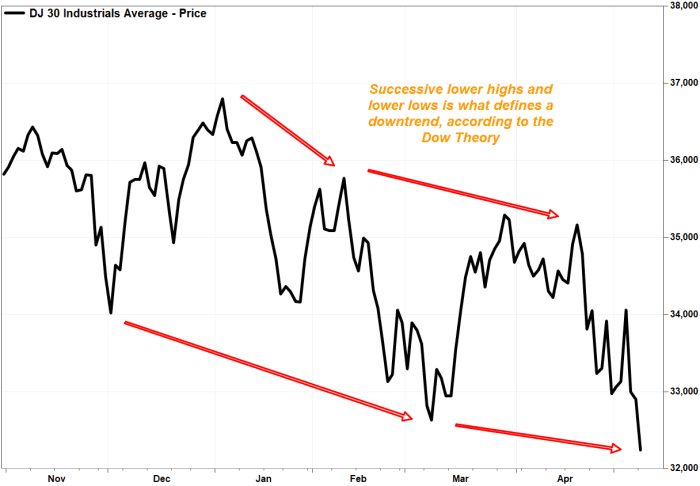
More importantly for chart watchers, the Dow saw its second lower close since it closed at a record 36,799.65 on Jan. 4, as the March 2022 low was below the Jan. 27 close of 34,160.78. Coupled with the fact that each successive bounce off those lows petered out below the previous peaks, with the March 29 closing high of 35,294.19 below the Feb. 9 close of 35,768.06, the Dow has confirmed a pattern of lower peaks and lower troughs.
Based on the Dow Theory of market analysis, which has remained relevant among Wall Street chart watchers for over a century, a pattern of lower highs and lower lows is what defines a downtrend. Read more about the Dow Theory.
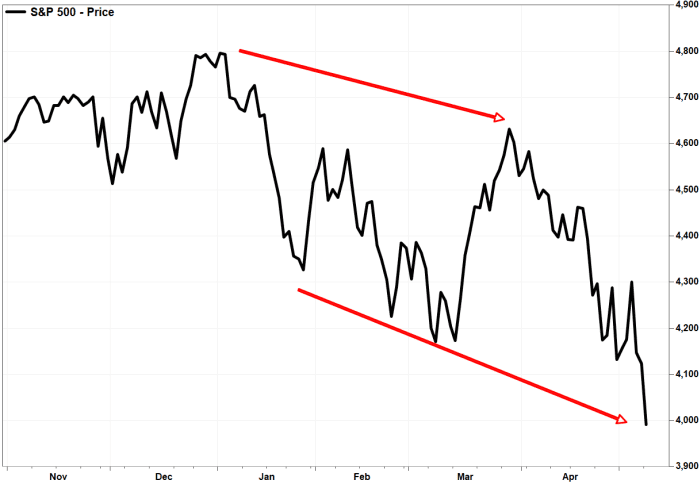
The Dow industrials has now matched the downtrend confirmed by the S&P 500 index SPX,
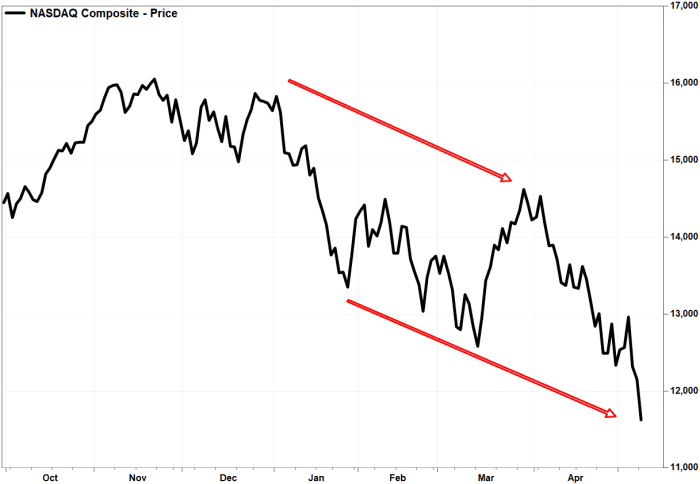
The Nasdaq Composite Index COMP had also already confirmed a downtrend, on April 26, when it closed below its March 14 low.
The S&P 500 backed up its downtrend with a five-week losing streak through Friday, only the ninth time the index has done that since 1992.
“While the sample size is small, persistent weakness like this has been a harbinger of additional selling in the months ahead more often than not over the last 30 years,” Frank Cappelleri, technical analyst at Instinet, a Nomura company, wrote in a note to clients.
Also read: Wall Street’s ‘fear gauge’ still not signaling stock-market bottom is near, analysts say
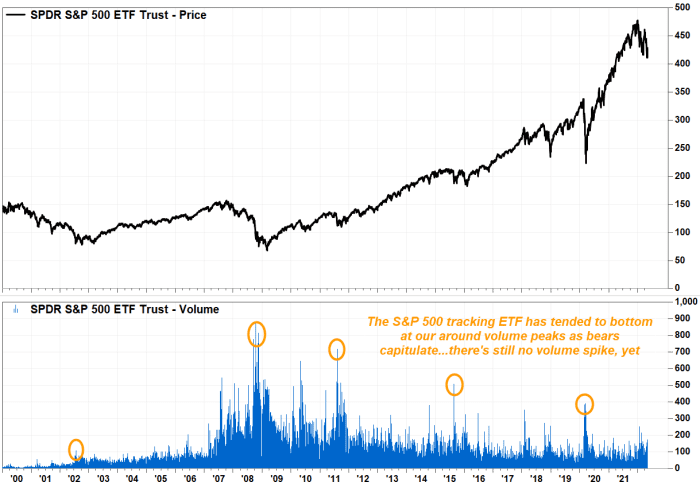
And after all the selling that has already occurred, that has led to a number of oversold technical readings, some market watchers see signs that indicate there are still those who haven’t finished selling.
“The volume over the past two weeks is unimpressive relative to both the volatility and weakness,” wrote Mike O’Rourke, chief market strategist at JonesTrading. “This equity market appears very far from any type of capitulatory mindset.”
So what’s next for the Big 3 indexes?
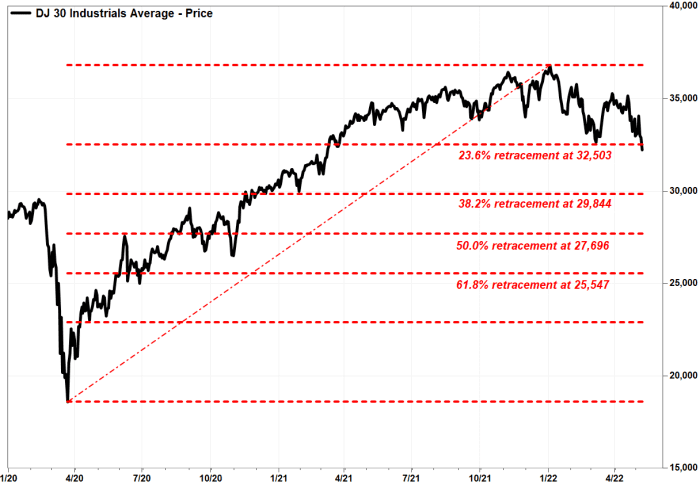
For the Dow, based on the rally off the pandemic closing low of 18,591.93 on March 23, 2020 and the Jan. 4, 2022 record close of 36,799.65, it has broken below the first Fibonacci retracement target of 23.6% at about 32,503. That makes the next retracement target, of 38.2%, at around 29,844, which would imply another 2,402-point drop from current levels. Read more about Fibonacci retracement targets.
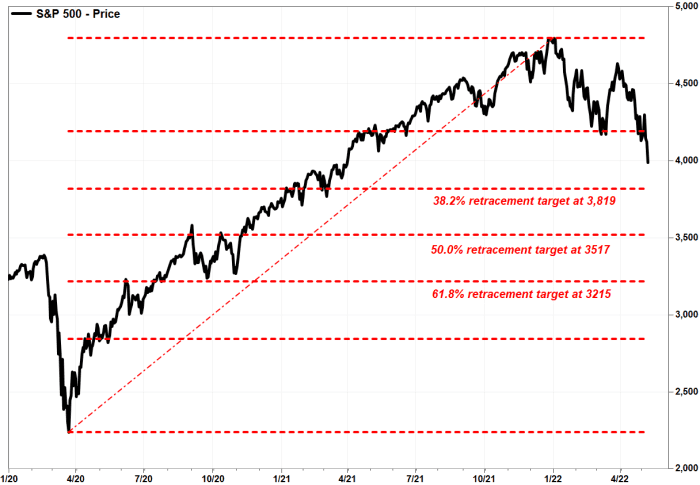
For the S&P 500, the next Fibonacci retracement target is the 38.2% retracement of the post-pandemic rally for the rally off the March 23, 2020 low of 2,237.40 to the Jan. 3, 2022 record of 4,796.56, which comes in at 3,81. The next one is the 50% target at 3,517.
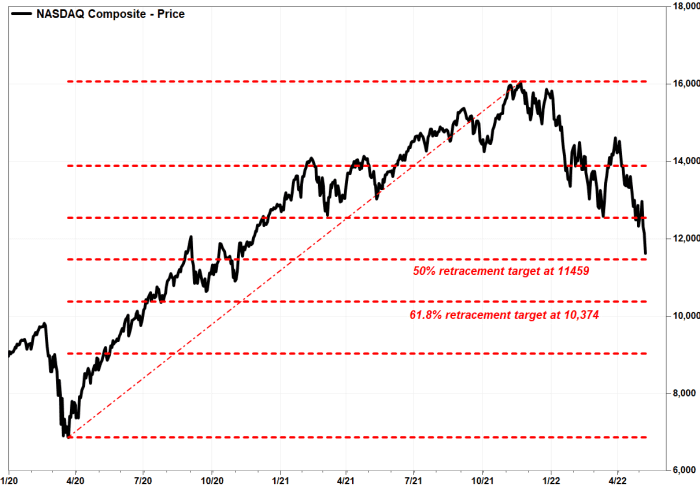
And for the Nasdaq, the index is approaching the 50.0% Fibo target of the rally off the March 23, 2020 low of 6,860.67 to the Nov. 19, 2021 record of 16,057.44, which comes in at 11,459. If that’s broken the next Fibo is the 61.8% target at 10,374.