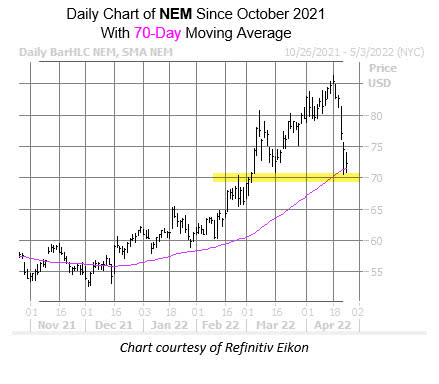
Gold producer Newmont Corporation (NYSE:NEM) hasn’t been immune to the pullback both stocks and commodities are facing today. Last seen down 3.5% at $71.89 and now just a week removed from its April 18 record high of $86.37, NEM is set to close at its lowest level since early March, shedding over 15% in that timeframe. Investors shouldn’t make any rash selling decisions, though, since based on its technical setup, the gold stock’s pullback appears to have found its floor.
It looks like the stock has found dual pronged support at the $71 level, as well as its 70-day moving average, which has signaled rebounds for NEM in the past. According to a study from Schaeffer’s Senior Quantitative Analyst Rocky White, Newmont stock has come within one standard deviation of this trendline five other times in the past three years. After 80% of these pullbacks, the equity saw a positive one-month return, averaging a 6.9% pop during this time period. A similar move from its current perch could help NEM gain some traction, putting back near the $76 mark. Another indicator that NEM could see a bounce soon is it’s 14-day Relative Strength Index (RSI) of 27, which sits firmly in “oversold” territory.
Despite its recent highs, analysts still aren’t convinced, and a round of bull notes could provide additional support. Of the 10 in coverage, just three say “buy” or better, while seven say “hold.”
There’s been a shift towards puts in the options pits, and an unwinding here might create tailwinds. While calls are still outnumbering puts on an overall basis at the International Securities Exchange (ISE), Cboe Options Exchange (CBOE), and NASDAQ OMX PHLX (PHLX), the stock sports a 10-day put/call volume ratio that stands higher than 94% of readings from the past year. In other words, these traders have had an unusually healthy appetite for long puts of late.


