Stocks have gained 8% in three months on this signal in the past, Bank of America says
Get ready to buy stocks.
That’s the advice a contrarian indicator from Bank of America is flagging, according to strategists in their Flow Show note released Friday.
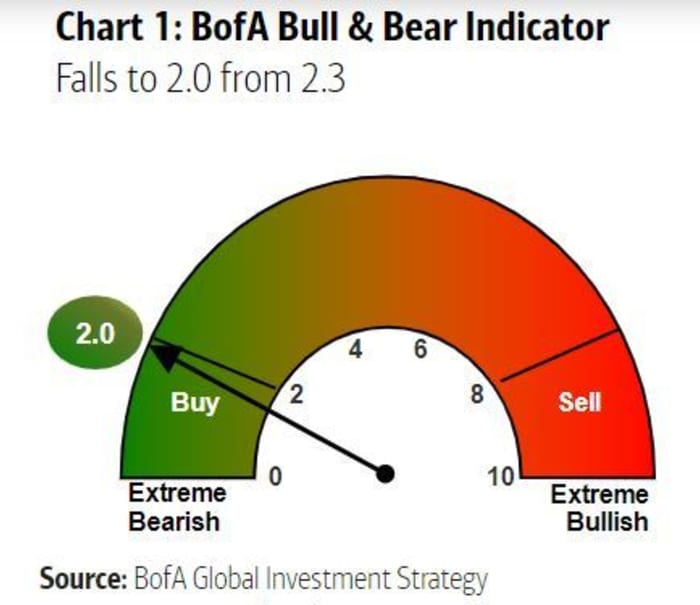
The bank’s proprietary indicator (pictured) gauges whether investor buying or selling of stocks has swung too far either side of a scale of zero to ten. The closer to 0— least bearish—and closer to 10—most bearish. The indicator sticks to this rule: when investor sentiment is over 8, sell equities, and when it’s under 2, buy them.
The indicator has dropped from 2.3 last week to 2.0 this week.
Eight such contrarian “buy signals” from that indicator have been seen since 2013, the last taking place in March 2020, noted a team of strategists led by Michael Hartnett. And their “backtesting shows that in the 12 weeks following buy signals, global equities have risen 8%,” global equities have outperformed IG [investment-grade] bonds and high-yield bonds have outperformed government bonds.
The S&P 500 SPX,
Those gains have come as investors have juggled concerns over a brutal invasion of Ukraine by Russia and mixed signals on the U.S. economy, as well as a Federal Reserve determined to stamp out inflation. The first half of the month has seen stocks dogged by concerns over the conflict that began more than a month ago, and ensuing fallout for the global economy.
Read: High U.S. inflation leaves consumer sentiment stuck at almost 11-year low
As for that contrarian buy signal, Hartnett and the team caution that it has an expiration date. Their fundamental 2022 view is that investors will endure shocks from inflation, interest rates and economic growth this year, leading to a “strong selling opportunity” in the second quarter. For the S&P 500 index, they see a move under 4,000 more likely than one 5,000 this year.
Also: Government bonds on track for worst year since the Marshall Plan was enacted
And: Why this part of the Treasury yield curve may be the ‘best leading indicator of trouble ahead’


