Don’t miss CoinDesk’s Consensus 2022, the must-attend crypto & blockchain festival experience of the year in Austin, TX this June 9-12.
While bitcoin’s bullish breakout has brought cheer to the crypto market, the U.S. bond markets appear to signal an economic recession, a bearish cue for risk assets.
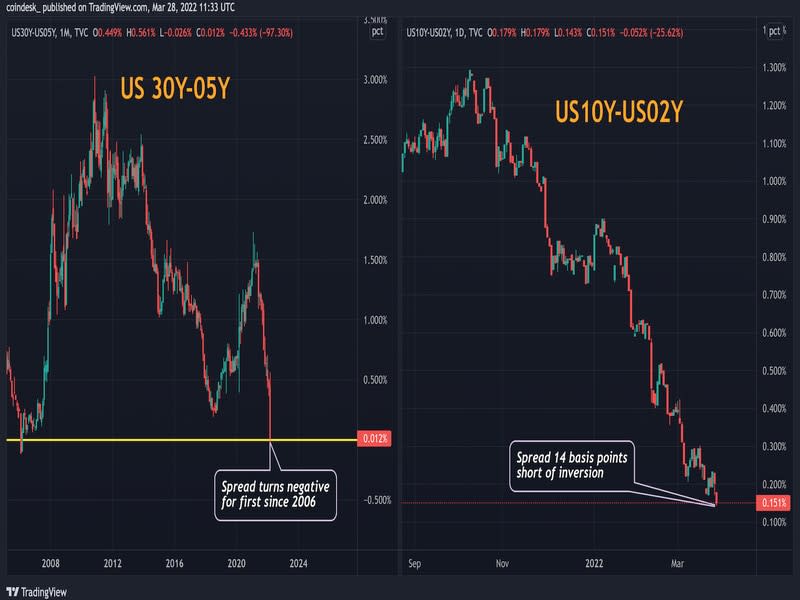
Data tracked by charting platform TradingView shows that a section of the Treasury yield curve inverted early on Monday. The spread between yields on the 30- and five-year government bonds fell under zero for the first time since 2006 – a year before the great financial crisis of 2007-2008.
The spread between the 10- and two-year yields, another widely tracked section of the yield curve, was 12 basis points short of inversion at press time. A yield curve is a graphical representation of expected returns from bonds of different maturities. Yields have an inverse relationship with bond prices – as price increases, yields fall.
An inverted yield curve is widely read as a sign of impending economic recession, a significant decline in economic activity that lasts for months or even years. According to the Federal Reserve Bank of San Francisco, the yield curve has inverted before each recession since 1955, with the economy taking a hit between six and 24 months following the inversion.
The recession hint provided by the latest curve inversion could have bearish implications for bitcoin. While the cryptocurrency hasn’t developed strong links to economic activity yet, it has evolved as a macro asset since the coronavirus crash of March 2020 and tends to move in line with risk assets, mainly technology stocks, which are sensitive to economic cycles.
At press time, bitcoin showed no signs of panic, trading 0.8% higher on the day at $47,200. Early Monday, prices escaped a two-month narrowing price range, opening doors for an extended move to the higher side.
The futures tied to the S&P 500, Wall Street’s benchmark equity index, traded flat, signaling a dull opening.
The latest curve inversion perhaps indicates that bond traders are skeptical about the Fed’s ability to control inflation without causing a recession. On one hand, rate hikes suck liquidity and help pull down inflation; on the other hand, they weigh over consumer and corporate spending and disrupt the virtuous economic cycle of high spending and high growth.
“Look at the massive flattening in the 2y10y — it’s signaling that the Fed’s ability to engineer a soft landing is quite narrow,” David Duong, head of institutional research at Coinbase, told CoinDesk in an email early this month after the Fed raised rates by 25 basis points and made the case for rapid tightening in the coming months.
Interest rate derivatives traders are now anticipating an increase in interest rates by 218 basis points by the end of the year. That’s equivalent to nine 25-basis point rate hikes over the next six Fed meetings.
Last week, Federal Reserve Bank of St. Louis President James Bullard and Cleveland Fed President Loretta Mester called for faster monetary policy tightening via interest-rate hikes in increments of 0.5 percentage point (50 basis points).
Why inverted yield curve represents recession fears?
The yield curve doesn’t cause recession by itself and only represents how bond traders see the economy evolving over the coming years.
The yield curve inverts when traders sell short-term bonds and park money in long-term bonds. It’s a sign that investors expect long-term interest rates to decline, which typically happens during economic slowdowns or recessions.
Sometimes, expectations of rapid rate hikes in the short term drive investors away from bonds maturing in one to five years, leading to an inverted curve. For instance, the two-year and five-year yields have seen bigger rallies this year than the 10- and 30-year yields.
The curve is usually upward sloping, with longer-duration bonds offering a higher yield than short-duration ones. That’s because both the risk of investments falling in value and growth prospects are higher with longer-duration bonds than with shorter ones.


