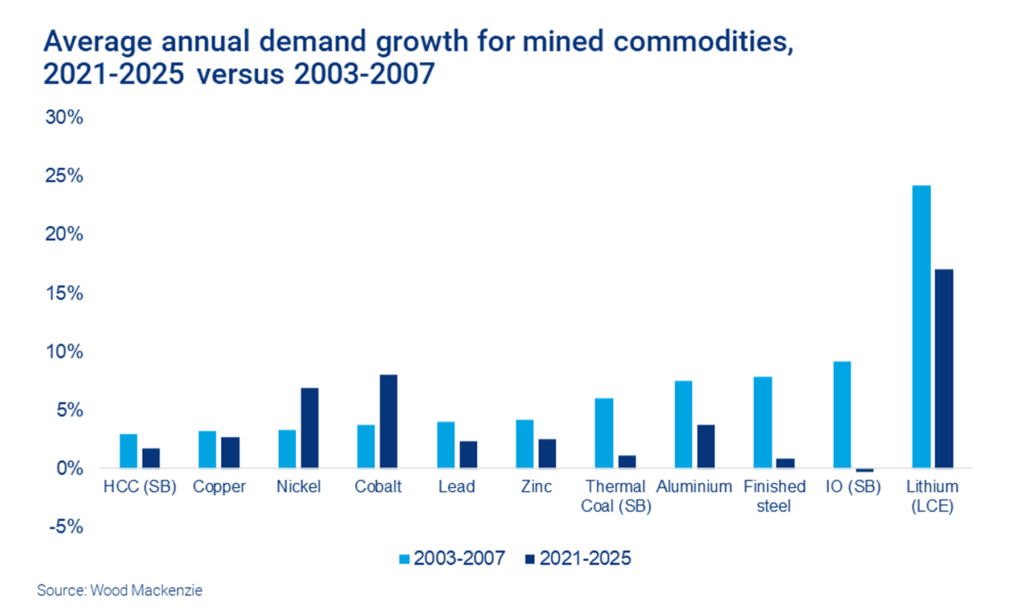
The latest entry in the genre is by Julian Kettle, senior VP and vice chair of Woodmac’s metals and mining business (read it here). Kettle’s first exhibit in Supercycle demand. Are we there yet? would be rather dispiriting if you’re in the bull camp. (A bull? Me?)
Bar cobalt and nickel, Woodmac’s demand growth projections for this cycle are noticeably lower than during the five-year period between 2003 and 2007 when the great sucking sound from the East was getting louder and louder.
We’ll get there EVentually
Even salt du jour, lithium, is going to be less boomy over the next five years than the early 2000s, when Tesla wasn’t even a twinkle in Musk’s eye, Nokia was the mobile phone company of the future and Volkswagen livestreaming a battery day would’ve seemed as silly as, you know, Volkswagen livestreaming a battery day.
As much fun as it is to talk about muskmobiles and their effect on mining, it’s worth remembering that EV batteries only overtook cellphones as the number 1 use of cobalt a couple of years ago, and as Kettle points out stainless steel will remain the top nickel application through this decade.
These battery metals (sorry lead-zinc, we just don’t think of you in that way anymore) are also flattered in percentage terms due to the small size of their markets.
Let the tonnes do the talking
Percentage changes only get you so far – mining is an altogether different beast than 18 years ago and Woodmac’s chart below shows in absolute growth terms the picture is decidedly rosier, but apart from the battery metals not exactly shooting the lights out.
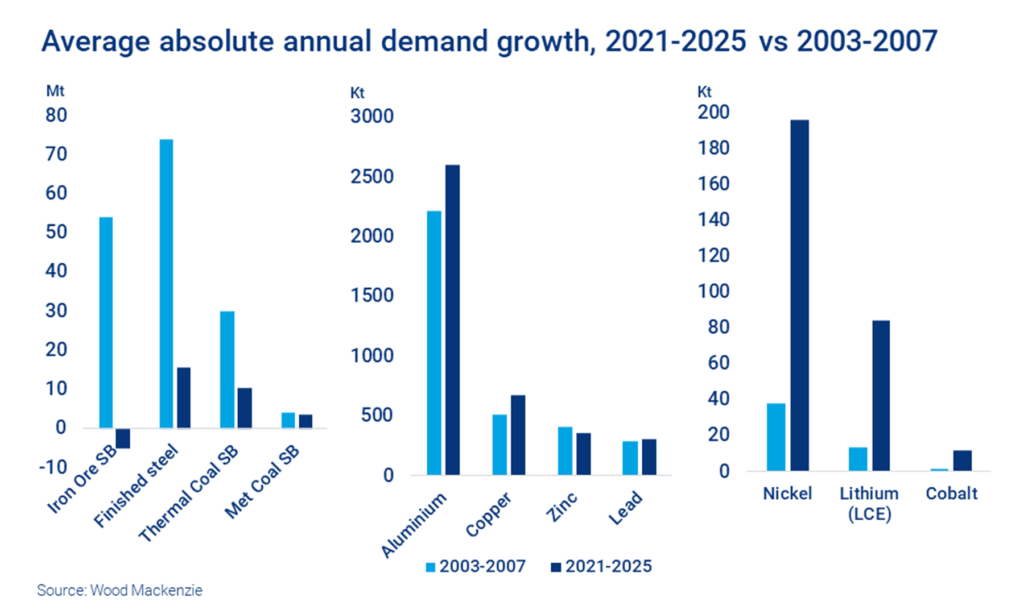
And the chart on the left in exhibit two (better not look Pilbara; close your eyes Pará) should give even the most ardent supporters of the supercycle story cause for pause.
Prices were hot across metals and minerals, but iron ore was by far the most profitable commodity last time around, accounting for two-thirds of ebitda for the big five diversifieds in 2011, up from 24% in 2007.
Ore wars
Demand for nickel growing at a 200kt clip, lithium at 80kt a year and cobalt at 10kt won’t exactly set hearts racing in Melbourne, London, Rio or Baar (more so in Jakarta and Kinshasa).
Not when compared to more than 50 million extra seaborne tonnes per year and a benchmark price going from $13.82 in 2003 (Japan-Australia-Brazil annual benchmark) to $191.70 a tonne (62% Fe Fines CIF Tianjin) seven years later.
MINING.COM’s most popular article of 2012 was headlined Forget gold, IRON ORE is the story of the decade which helps explain why hundreds of millions were allocated to study projects like Outer Harbour to the dismay of natator depressus fans everywhere.
Outer Harbour wasn’t the only outre project either. During the go-go days, cash from the iron cow was ploughed into all kinds of mega-projects with no railway line too long to consider constructing, ship too big to commission (warning: link contains profanity) or overburden too massive to haul away.
Animal spirits evaporated
Years of shareholder castigation have left a much chastened industry, and despite a return to mega-profits at the top tier, focus remains on dividends and capital discipline, not gearing up for growth.
Even half-brainer decisions like BHP’s Jansen in Saskatchewan and Rio’s Jadar in Serbia (Djokovic’s double fault notwithstanding, it’s lithium, duh!) appear to agonise boards.
Does it really take Brazil granular at $800 and ballistic lithium prices to clear investment hurdles? Must copper go to $30,000 before animal spirits are released?
Judging by this chart by Fitch Solutions, the answer – even after a healthy $12 billion upward adjustment from previous estimates – appears to be yes.
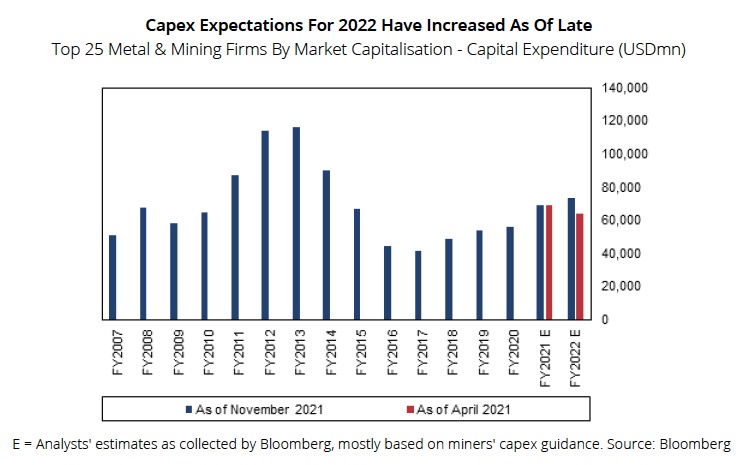
At the peak in 2013, the top 25 largest mining companies had outlays of $117 billion; the second year in triple digits. Next year it may rise beyond $70 billion.
All the fields are brown and the sky is grey
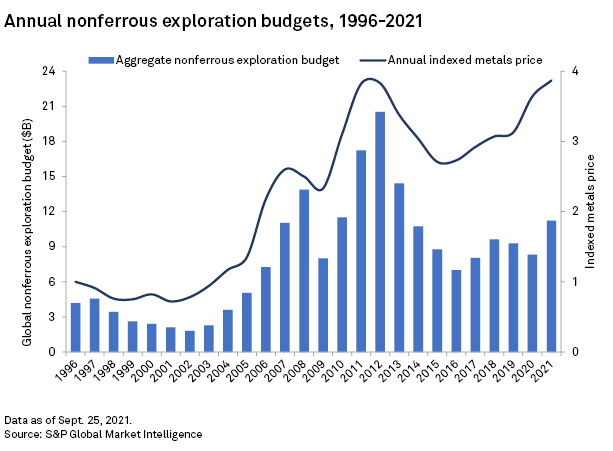
During the Beijing boom, exploration budgets (non-ferrous, but really who drills for iron?) were considerably larger than they are today despite metal prices at similar levels.
Greenfield exploration was a thing – as late as 2013 half of the top ten largest copper expansion projects were greenfield. Early-stage exploration budgets in 2020 fell to their lowest on a percentage basis, and after a slight uptick this year still accounts for only 26% of budgets.
Neither did boards shrink from frontier markets. Now they are finding that what were considered South American safe bets are degrading faster than ore overages in the Andes. Trial balloons about entering Africa are found to be made of lead and advancing a project in US jurisdictions remains a life sentence.
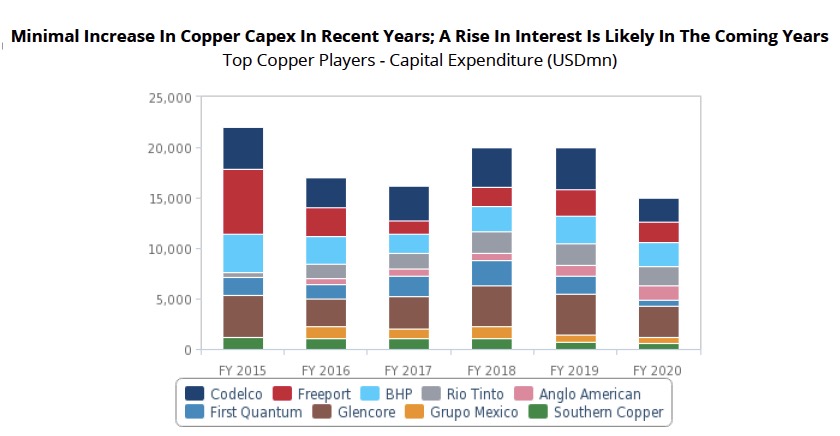
Copper capex chill
If iron ore was doing the heavy lifting in the 2000s and early 2010s, it will be up to copper to supersize this cycle.
But copper’s top tier hasn’t exactly gone capex crazy and when there is spending it’s mostly to keep production steady or fulfill environmental pledges – another day, another desalination plant.
Only a fraction of the 28,000 mining trucks in operation globally are zero emissions. Lithium-ion batteries aren’t getting cheaper anymore and even with sweet tax incentives like Canada’s, just to convert what you already have will take away dollars from expansion plans.
Pricing to scare
In a recent report headlined: Copper: Pricing to scarcity, Goldman Sachs calls copper the most mispriced commodity. Scarcity is a pretty strong word to use in any report about commodities.
The investment bank has recapitulated its bullish forecast for copper to average $11,875 a tonne (just below $5.40 per pound) next year and step gains to $15,000 ($6.80) in 2025.
But Goldman is a lonely voice.
A monthly poll conducted by FocusEconomics released Thursday shows wide disparities in forecast prices by the investment banks, brokers, economists and governments collected December 1 – 6.
Among investment banks, the lowest forecast among the more than 30 participants for the average price next year is by BMO Capital Markets, which predicts copper to retreat to the $7,875 ($3.60) level (and $6,625 in 2023, ouch!).
RBC and Société Générale are also firmly in bear territory with forecasts around $8,250 in 2022 while TD Securities, Capital Economics and Citigroup barely see copper scaling $9,000 next year. The consensus forecast for 2022 is an average of just over $8,900, sliding to $8,480 in 2023.
All blame a slowing China, particularly its property sector, for the bearishness.
We’ll always have Qingdao
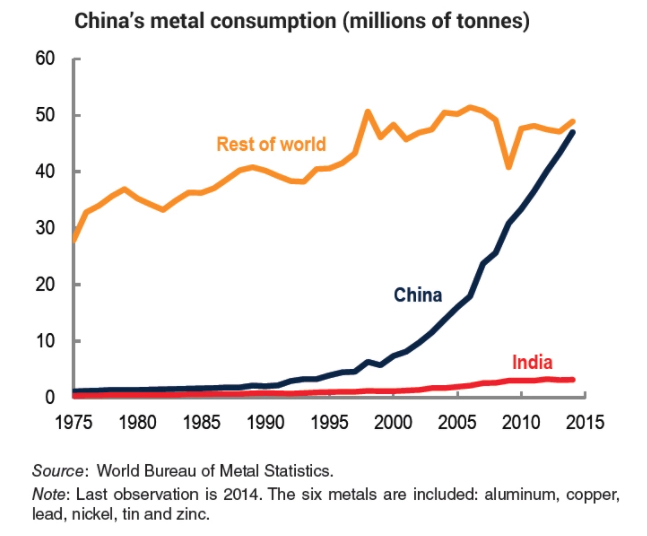
The final chart is six years old and from the World Bank Commodity Outlook for 2016 (unfortunately not available for public viewing anymore) which rather belatedly forecasted a severe downturn in Chinese commodity consumption.
China’s economic growth rate may have slowed to 30-year lows, but in absolute terms, the country’s economy will add the equivalent of Turkey’s GDP this year, two South Africa’s worth of economic activity, three Philippines, four New Zealands, and no less than five nominal Hungarys.
If you’re talking tonnes of metal rather than trends that should be unalloyed good news. But looking at this chart, 2021 to 2035 cannot but fall short of 2000 to 2014.