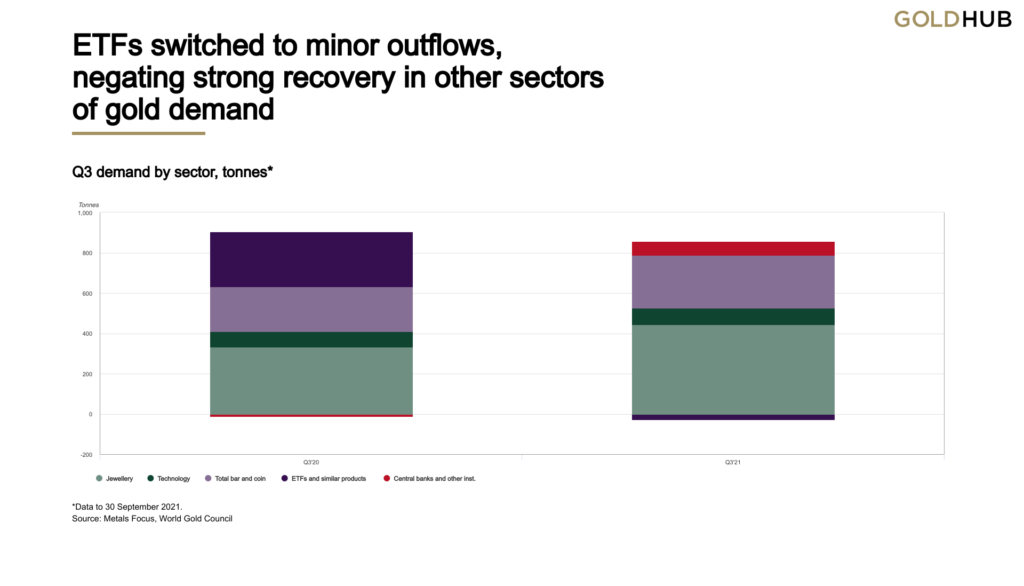
Jewellery, technology and bar and coin were significantly higher than in 2020, data showed. Modest central bank purchases were also a solid improvement on the small net sale from Q3 2020.
Jewellery continued to draw strength from the ongoing global economic recovery: Q3 demand rebounded 33% to 443 tonnes.
Bar and coin investment increased 18% to 262 tonnes. The sharp August gold price dip was used by many as a buying opportunity.
Technology gold demand grew 9%, driven by continued recovery in electronics. Demand of 84 tonnes is back in line with pre-pandemic quarterly averages.
Small outflows from global gold ETFs (-27 tonnes) had a disproportionate impact on the year-on-year change in gold demand, given the hefty Q3 2020 inflows of 274 tonnes.
Central banks continued to buy gold, albeit at a slower pace than in recent quarters. Global reserves grew by 69 tonnes in Q3, and almost 400 tonnes year-to-date.
Global gold demand remains notably weaker since the start of the year when compared with the same pre-pandemic period of 2019.
Year-to-date demand is 9% lower, with the doubling of central bank buying and 50% growth in jewellery demand over the first three quarters only partly offset the decline in ETF demand.
Gold supply, on the other hand, remains relatively flat this year as mine production has steadily increased throughout 2021.
The year-to-date total is up 5%, but recycling has slowed down significantly, contracting by more than 12% over the same period. The Q3 supply was down 3% due to a significant drop in recycling.
Given the market trends, the WGC predicts that economic recovery will benefit jewellery and technology.
Gold investment should also draw support from continued inflation fears, but relatively modest ETF flows will compare negatively with 2020’s record inflows.
Meanwhile, central banks are poised for an above-average year of net purchases, it added.
Gold price averaged $1,789.5/oz during Q3, which is marginally lower than the Q2 average. The year-on-year comparison shows a 6% fall, reflecting the August 2020 record high US dollar.


