Facebook Inc. is among the most-searched-for companies on MarketWatch. This quarterly review of Facebook FB,
These updates will also include comparisons of results to competitors. Keep in mind that no two companies are alike — even rivals don’t compete in every space. Any investor needs to do their own research to make informed long-term decisions.
Where Facebook fits in
Facebook isn’t yet in the Trillion Dollar Club of mega-cap tech stocks, but it’s pretty close. At about $780 billion in market capitalization, it is the fifth-largest publicly traded company in the U.S. despite only entering public markets fairly recently.
In fact, we will soon mark the 10th anniversary of Facebook’s IPO on May 18, 2012, at a mere $38 per share. The stock price of this social media icon has increased almost 10-fold since then, as it has become a massive force of technology and media that boasts a staggering 2.85 billion monthly users worldwide. That reach comes with powerful profit potential, but also increased scrutiny by users and politicians amid fears of misinformation and privacy concerns.
That creates an interesting dynamic for investors, as the reality that it already reaches roughly one in three people in the world (based on its internal user metrics, anyway) means Facebook will likely have to find a path to bigger revenue or earnings expansion another way than adding more people to its existing platforms.
Key Metrics
Active users
A look at Facebook’s geographic segments shows the future path to growth for this company pretty clearly. Facebook reports more than 250 million users in the U.S. and Canada — but census figures show only about 210 million U.S. residents age 18 and over. Even if some of those accounts are duplicates, fakes or just noise, the general reality of this dynamic means there aren’t that many people left to sign up.
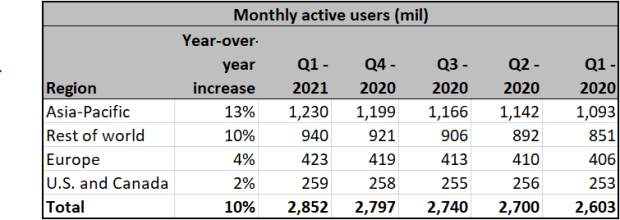
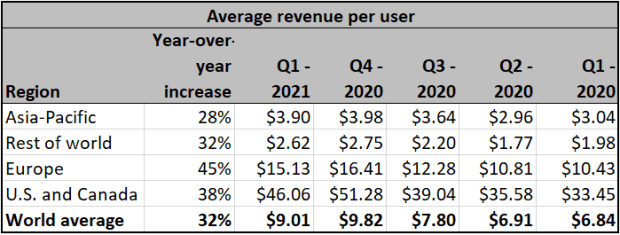
However, though the social media company’s footprint in the U.S. and Canada remains its smallest user segment when you measure by people and is admittedly challenged when it comes to future growth, this region is actually the crown jewel because of how much revenue each user generates.
Specifically, despite having less than 10% of its user base here, the company generates about three times the revenue of Europe, and nearly 18 times the revenue of its worst-performing “rest of the world” catch-all segment.
Sales growth
Related to this, it’s worth noting that the vast majority of revenue at Facebook comes from ads it serves on its platform. Last quarter, the company’s advertising sales totaled $25.4 billion, as it generated a mere $732 million from “other” streams that include its Oculus VR hardware, payments and a handful of other minor business lines.
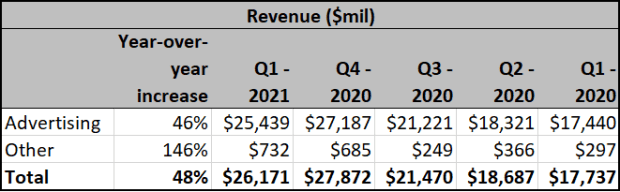
Though its “other” segment is growing more quickly, the massive 46% expansion in an already dominant ad business means it matters most to investors. And as mentioned, as this existing advertising business is built on valuable users in the developed world, the future of Facebook’s stock depends on international growth, profit expansion or a dramatic move into new products and services that could significantly move the needle in its “other” segment.
Pricing power and profitability
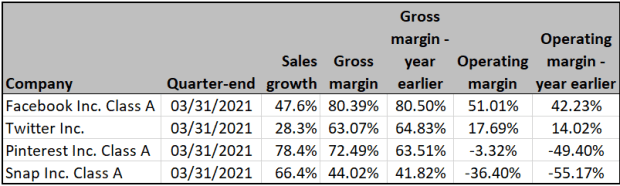
Facebook’s gross margin and operating margin are significantly better than the norm among its closest peers in social media.
Gross margin only figures in direct costs of doing business, while operating margin include things like salaries and R&D. While it’s perhaps understandable to see Snap Inc. SNAP,
They’re narrowing the gap, though, as Facebook’s margins are steady and both SNAP and PINS are seeing significant user growth. (Pinterest grew users by 30% year-over-year, and Snap users grew 22% in the first quarter. Twitter Inc.’s TWTR,
Free cash flow
Free cash flow is increasingly a figure investors care about, because it’s a sign of how much cash a company has left after paying for normal operations. And perhaps unsurprisingly, given the fact that Facebook has a massive and lucrative user base, it blows away the competition here, too.
Here are the specifics on how Facebook matches up with peer social media companies when it comes to free cash flow per share for the past 12 reported months from the year-earlier 12-month period, along with trailing 12-month free cash flow yields, based on closing share prices on April 30:
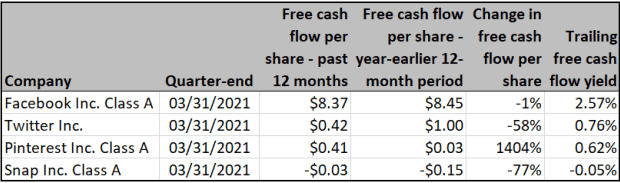
The modest year-over-year decline of 1% isn’t ideal. But considering everyone other than Pinterest also saw decay, that’s not necessarily the end of the world.
Stock valuation and performance
There are some who think the old-school valuation metrics of the past aren’t relevant for a new generation of social media or tech stocks. However, it’s important to note that even by these traditional measures, Facebook isn’t overvalued even when you use the calculations of yesteryear, even though it is a relatively new tech-focused stock.
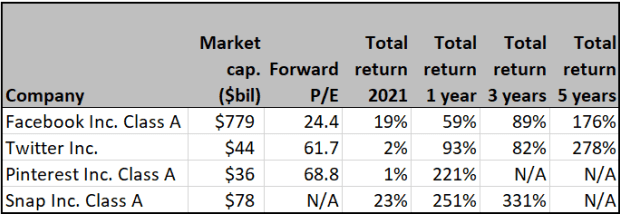
Specifically, Facebook’s price-to-earnings (P/E) ratio is 24.4, based on the consensus earnings estimate for the next 12 months among analysts polled by FactSet. The forward P/E ratio for the next year’s earnings forecast is only around 25, while the forward P/E for the S&P 500 Index SPX,
So Facebook’s P/E is not only in line with the norm for the broader market and well below its peers, it is particularly reasonable considering a history of growth may prompt many investors to grant Facebook a bit of a premium valuation above sleepy stocks in other sectors.
Here are P/E valuations for Facebook and its peers, based on consensus earnings estimates for the next 12 months among analysts polled by FactSet, along with total return figures through April 30.
Wall Street’s opinion
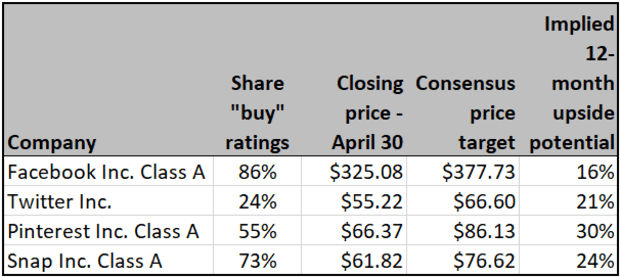
If you’ve been following along, you won’t be particularly surprised to see the enthusiasm for Facebook on Wall Street. Given Facebook’s massive user base, best-in-class margins and fair valuation, a whopping 86% of analysts consider this stock a buy, and as a group are plotting double-digit upside in the next year based on consensus price targets.
Sure, these same analysts think Pinterest and Snap may have more implied upside if things go well. But if you’re less interested in up-and-coming social media stocks and instead want to rely on a stable long-term leader, Facebook has plenty to offer.
Here’s a summary of opinion among Wall Street analysts polled by FactSet:
Important dates
- April 28 — Facebook just reported its first-quarter results.
- May 26 — Facebook annual shareholders meeting.
With reporting by Philip van Doorn.


