The stock market’s summer rally ran out of steam in August. Here’s what history says about September.
A summer U.S. stock-market rally off lows for the year seen in June shuddered to a halt in August, leaving major indexes with monthly losses as investors braced for the start of a traditionally unpleasant month for equity bulls.
Since 1950, September has been the worst performing month of the year for the Dow Jones Industrial Average DJIA,
But what happened in August? The first half of the month was all about momentum. After confirming a bear market in June with a slide more than 20% below its Jan. 3 record finish, the S&P 500 bounced off its June 16 low. The bounce picked up steam in July and extended into August, clearing a number of technical hurdles that had market watchers weighing whether the rise was perhaps shaping up to be more than a typical bear-market rally.
The 200-day moving average, however, appeared to be a bridge too far. After ending at a nearly four-month high on Aug. 16, the S&P 500 stalled out at the long-term average.
On the macro-economic side, tentative signs of inflation peaking generated notions of a policy pivot by the Federal Reserve, with officials pausing and then beginning to unwind interest rate hikes in 2023 and were credited with providing a lift for stocks. Fed officials pushed back on that scenario and last Friday, Chair Jerome Powell sent a clear message that rates were likely to move higher and remain high for longer even if it resulted in economic pain.
So stocks on Wednesday, the last trading day of the month, suffered a fourth straight loss, leaving the S&P 500 down 4.2% for the month, the Dow down 4.1% and Nasdaq with an August loss of 4.6%. The S&P 500 is down 17% year to date, while the Dow has slumped 13.3% and the Nasdaq has dropped 24.5%.
Deep Dive: Here are the worst (and best) performing stocks of August and for 2022
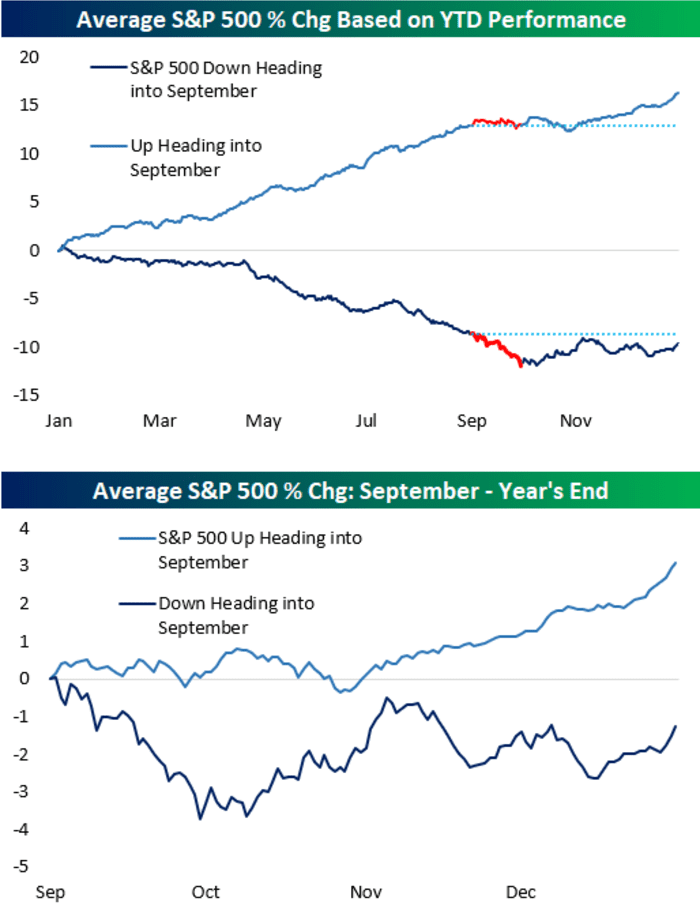
September has often provided even more of a seasonal headwind in years when stocks were down year to date heading into August, said analysts at Bespoke Investment Group, in a Wednesday note, citing S&P 500 performance going back to 1928.
“When the S&P has been down YTD (year to date) through the end of August (as it is this year), the index has averaged a decline of 3.4% in September, whereas September has been flat when the index was up YTD heading into the month,” they wrote. “For the remainder of the year, the index has averaged a loss of 1.2% when coming into September with YTD losses and a gain of 3.3% when coming into September up YTD. “ (See chart below).
The market’s weak September performance in the month shows a “remarkable consistency,” MarketWatch’s Mark Hulbert wrote in an Aug. 23 column. The problem for traders, however, is that the cause — if there is one — remains a mystery, which makes placing bets based solely on the pattern a dubious proposition.
See: Oil prices mark their longest monthly losing streak in more than 2 years


