Key Insights:
-
On Saturday, bitcoin rose by 0.56% to log a sixth daily gain from eight sessions.
-
Negative chatter over crypto regulations and market sentiment towards Fed monetary policy pegged bitcoin back from a more material gain.
-
Bitcoin (BTC) technical indicators remain bearish, with bitcoin sitting at the 100-day EMA.
On Saturday, bitcoin (BTC) rose by 0.56%. Partially reversing a 2.50% fall from Friday, bitcoin ended the day at $29,845.
A bearish start saw bitcoin fall to an early morning low of $29,467 before finding support.
Steering clear of the day’s Major Support Levels, bitcoin struck an afternoon intraday high of $29,954.
Falling short of the First Major Resistance Level at $30,488, however, bitcoin slipped back into the red before a late recovery.
Saturday’s upside came despite the US nonfarm payroll figures on Friday, which supported a more aggressive Fed interest rate path trajectory.
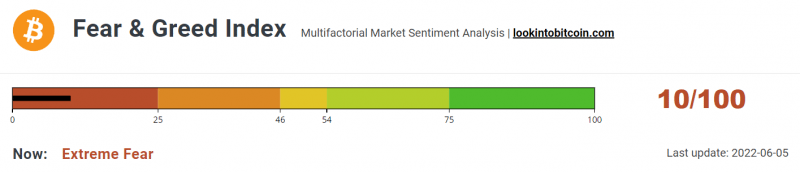
The Bitcoin Fear & Greed Index Sits Deep in the Extreme Fear Zone
Today, the Fear & Greed Index fell from 14/100 to 10/100 despite bitcoin’s Saturday gain and the prospect of ending a nine-week losing streak.
While falling deeper into the “Extreme Fear” zone, the Index continued to hold above May’s low of 8/100.
Regulatory chatter was market negative, with regulators and lawmakers calling for greater oversight.
Going into the weekend, Governor Christopher J. Waller talked about “Risk in the Crypto Markets.”
The governor talked of high volatility being the rule and not the exception and the frequent occurrence of fraud and theft.
Waller also focused on retail users with a lack of crypto experience and the need for some standard rules.
South Korean lawmakers were also active going into the weekend. According to local media, regulators plan to move beyond the Capital Markets Act following the collapse of TerraUSD (UST) and Terra LUNA.
Bitcoin (BTC) Price Action
At the time of writing, BTC was down 0.45% to $29,712.
A range-bound start to the day saw bitcoin rise to an early morning high of $29,882 before falling to a low of $29,712.

Technical Indicators
BTC will need to move back through the $29,754 pivot to target the First Major Resistance Level at $30,045.
BTC would need the broader crypto market to support to break out from Saturday’s high of $29,954.
An extended rally would test the Second Major Resistance Level at $30,241 and resistance at $30,500. The Third Major Resistance Level sits at $30,728.
Failure to move back through the pivot would test the First Major Support Level at $29,554. Barring another extended sell-off, BTC should steer clear of sub-$29,000 levels. The Second Major Support Level at $29,267 should limit the downside.

Looking at the EMAs and the 4-hourly candlestick chart (below), it is a bearish signal. Bitcoin sits below the 50-day EMA, currently at $30,051. The 50-day pulled back from the 100-day EMA. The 100-day EMA slipped back from the 200-day EMA; BTC negative.
A move through the 100-day EMA, currently at $30,260, would support a run at $31,000.

This article was originally posted on FX Empire


