The new rock-to-metal ratio is explained in a USGS and Apple study recently published in Environmental Science & Technology. The authors used the most current data available to determine the ratios of 25 of the most commonly used mineral commodities. The ratio they developed considers various mining factors, such as ore grades and recovery yields, to estimate the weight of ore and waste produced at more than 1,900 mining operations worldwide.
“The rock-to-metal ratio and the underlying data have many potential uses,” said Nedal Nassar, chief of the Minerals Intelligence Research Section at the USGS National Minerals Information Center and lead author of the study. “For instance, manufacturing companies could use our data as one of several deciding factors on where to source minerals and or which materials they use in their products.”
While the rock-to-metal ratio can provide some clues to the environmental impacts of various mining operations around the world, Nassar is quick to add that “this is only one piece of a larger puzzle, and the rock-to-metal ratio needs to be used in conjunction with other data to make informed decisions about mineral sourcing or material choice.”
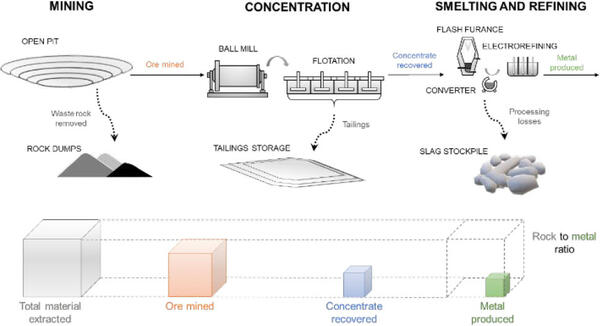
The study shows there is a wide range in rock-to-metal ratios among different mineral commodities. For example, iron ore has a rock-to-metal ratio of 9:1. This means for every nine metric tons of waste rock and ore moved and processed, one metric ton of iron is produced. This was one of the lowest ratios found in the study. Gold, on the other hand, was found to have the highest ratio at about 3,000,000:1, which means for every three metric tons of ore and waste rock moved and processed, only one gram of gold is produced.
The above ratios are global averages for iron and gold. There is also wide variability among the ratios for each metal, depending on where it is produced.
This variability in the ratios for a single mineral commodity is one of the key pieces of data Apple was interested in when they initially approached the USGS to collaborate on this study. The rock-to-metal ratio can also provide companies an additional way to quantify the benefits of recycling by showing how much waste removal and ore mining could be avoided by recycling these materials.
A key finding of the study revealed that the worldwide total of ore and waste rock moved in 2018 for the 25 mineral commodities was about 37.6 billion tonnes. This enormous number can be difficult to comprehend, but it’s roughly the equivalent of almost 7,000 Great Pyramids of Giza being moved each year.
The 25 minerals analyzed in the study are used by virtually every manufacturing industry in the global economy and include aluminum, chromium, cobalt, copper, gallium, gold, iridium, iron, lithium, magnesium, molybdenum, nickel, palladium, platinum, rhodium, ruthenium, silicon, silver, tantalum, tin, titanium, tungsten, vanadium, zinc, and zirconium.
The full study can be read in PDF form.


