Selloff puts S&P 500 on bear market’s doorstep. If history is a guide, there’s more pain ahead.
History shows that when the S&P 500 enters a bear market, it tends to stay awhile.
Back-to-back drops left the large-cap benchmark SPX,
The Dow Jones Industrial Average DJIA,
To be sure, many investors and analysts see that 20% definition as an overly formal if not outdated metric, arguing that stocks have been behaving in bearlike fashion for weeks.
So far 61% of individual companies in the S&P 500 are in bear market territory, observed Mike Mullaney, director of global markets research at Boston Partners.
”We’re kind of there, but it hasn’t shown up in the broad index yet,” he said, in a Thursday interview.
And note, that if the S&P 500 were to close below the threshold in the coming days, the start of the bear market would be backdated to the Jan. 3 peak. A bear market ends once the S&P 500 has risen 20% from a low.
OK, so what does history say about what happens once a bear market begins?
There have been 17 bear —- or near-bear—- markets since World War II, said Ryan Detrick, chief market strategist for LPL Financial, in a Wednesday note. Generally speaking, the S&P 500 has had further to fall once it begins. And, he said, bear markets have, on average, lasted about a year, producing an average peak-to-trough decline of just shy of 30%. (see table below).
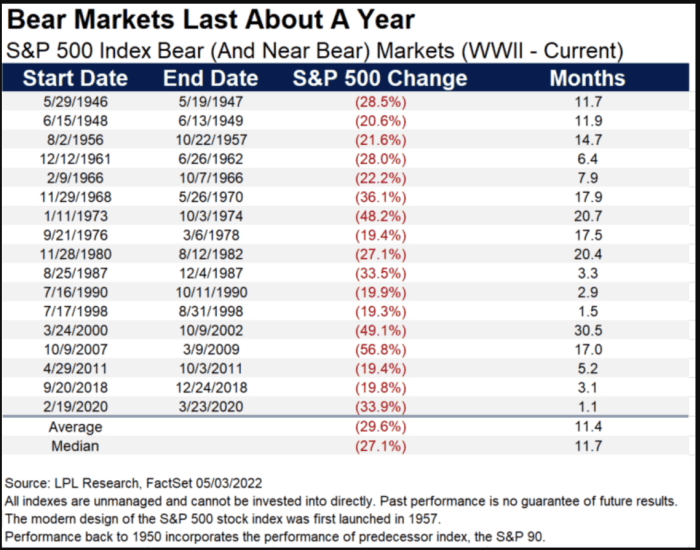
The steepest fall, a peak-to-trough decline of nearly 57%, occurred in the 17 months that marked the 17-month bear market that accompanied the 2007-2009 financial crisis. The longest was a 48.2% drop that ran for nearly 21 months in 1973-74. The shortest was the nearly 34% drop that took place over just 23 trading sessions as the onset of the COVID-19 pandemic sparked a global rout that bottomed out on March 23, 2020, and marked the start of the current bull market.
The S&P 500 neared bear territory last week before a strong Friday-the-13th bounce that halved its weekly losses. Another strong bounce was seen Tuesday, but gains were more than erased in the following session after downbeat results from retailing giant Target Corp. TGT,
The earnings from Target and, a day earlier, Walmart Inc. WMT,
”Namely, that the length of high inflation has infiltrated the lower income cohorts of the economy, and they are now reacting, quickly. And as inflation stays high and the economy slows, that will creep ‘up’ the income distribution, and the concern is the margin issues TGT and WMT are facing will spread to other parts of the retail space and the market more broadly,” Essaye wrote.
Mullaney at Boston Partners worries that Wall Street analysts have yet to catch up to the danger. While earnings expectations for companies in emerging markets and the broader developed-markets indexes have turned down, that isn’t the case for the S&P 500, he noted. That indicates that the analysts covering the S&P 500 are “behind the curve,” which could be one of the last shoes that has to drop.


 Is Well Worth Watching")

