“Top Gun: Maverick” is taking American cinemas by storm, so it’s only right that Wall Street strategists would work some references to the classic 1980s franchise into their client research which is often shared with the media.
And now that U.S. stocks have broken a historic string of weekly losses, market analysts are looking to technical indicators to determine where the “danger zone” for equities might lie.
The ‘danger zone’
According to Jonathan Krinsky, a market technician at BTIG, the new “danger zone” for U.S. stocks corresponds roughly with the 50-day moving average for the S&P 500 SPX,
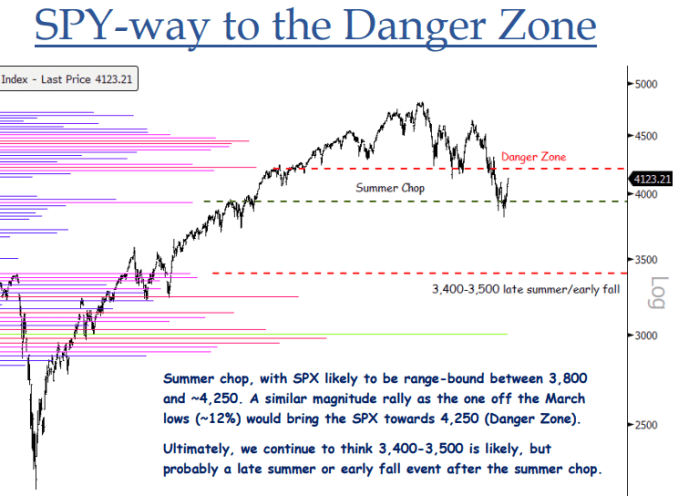
Reaching the 50-day moving average would be quite a feat in itself, seeing it would represent a roughly 12% rally off the bear-market lows just above 3,800 from which the S&P 500 bounced earlier this month, while the Dow bottomed out just north of 30,600 DJIA,
A counter-cyclical rally
Interestingly, Krinsky pointed to a overstretched positioning in the best-performing sectors for stocks (i.e. energy), claiming that “the strategy of buying winners and selling losers is coming off the most extreme level in over 13 years.” Because of this, Krinsky expects a swift bout of counter-cyclical reversion – where technology stocks lead markets higher, a dynamic that has already been witnessed during the past week – to be the near-term catalyst for a rebound in stocks.
He pointed to trading action during the summer of 2008, where the S&P 500 saw a double-digit rally (in percentage point terms) before ultimately collapsing later in the year. That rally was also characterized by counter-cyclical moves, as long-short momentum funds endured heavy losses.
In such a “reversion” scenario, Krinsky believes the Nasdaq 100 – represented in Krinsky’s note by the Invesco QQQ ETF QQQ,
What about the ‘VIX’?
Following the period of summer chop, Krinsky believes U.S. stocks will eventually move lower to plumb new depths as the fall approaches. This brings us to the CBOE Volatility Index – otherwise known as the ‘VIX’ VIX,
According to Krinsky, clients have asked many times why the VIX hasn’t been able to hold above 35 despite a nearly 20% selloff in the S&P 500 from peak to trough.
Krinsky argues that a move to 40 or above on the VIX could still arrive – but it might not come until later in the summer, or the fall.
“In 2000 and 2008, it took nearly a year of a weak market, and then some sort of ‘event shock’ like 9/11 or Lehman to get a surge above 40,” Krinsky said.


