A death cross for the S&P 500 is nearing as inflation fears, Russia’s Ukraine offensive rattles stock-market investors
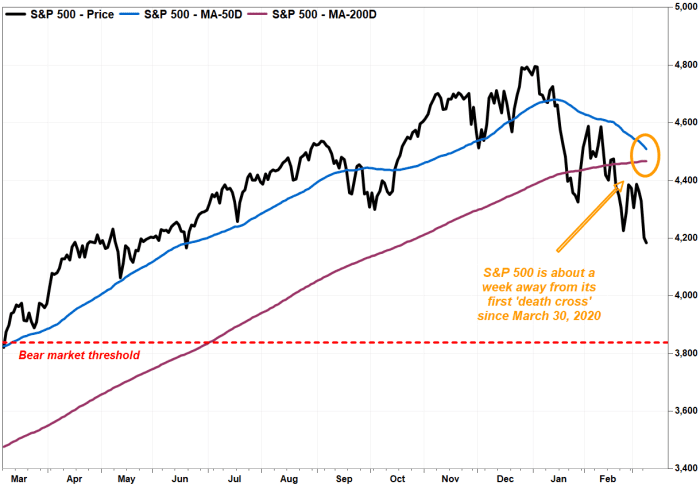
The S&P 500 index is closing in on a death cross, an ominous chart pattern that underscores the downtrend suffered in an asset.
A death cross appears when the 50-day moving average crosses below the 200-day moving average, an event that many chart watchers view as marking the spot a shorter-term correction morphs into a longer-term downtrend.
At last check, the S&P 500 index SPX,
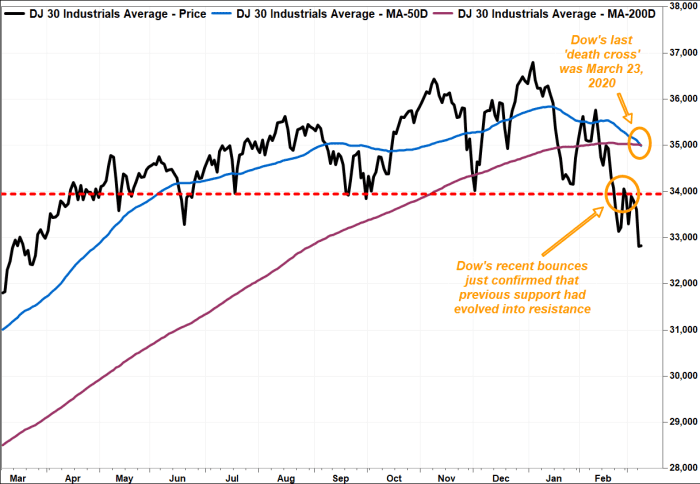
The approach of a death cross for the broad-market benchmark comes as the Dow Jones Industrial Average DJIA,
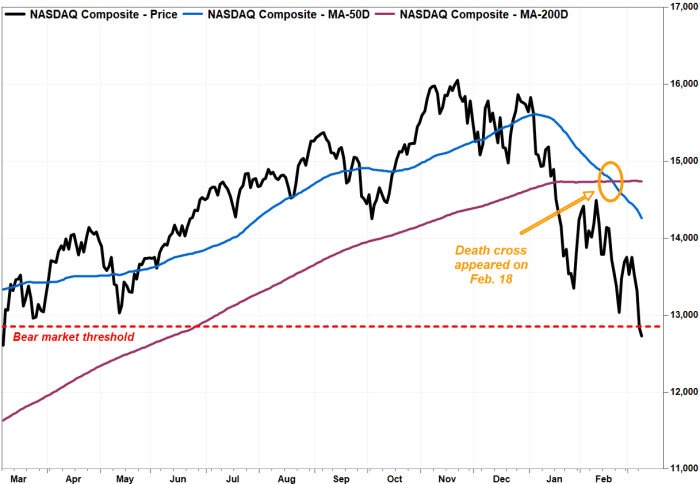
A number of other assets have seen death crosses materialize, including the technology-laden Nasdaq Composite Index COMP,
The last time the S&P 500 registered a death cross was nearly two years ago on March 30, 2020, at the height of the pandemic-induced selling. The DJIA saw its death cross materialize at what is widely viewed as stock’s bear-market bottom on March 23, 2020.
It is worth noting that such crosses aren’t necessarily good market-timing indicators, however, as they are well telegraphed, but they can help put a selloff in historical perspective, technicians say.
The decline in the broader market was taking hold, with safe-haven assets, including gold GC00,
See: More than a quarter of Nasdaq-100 stocks are in bear markets—Wall Street sees a buying opportunity
Crude-oil futures CL.1,
The geopolitical tensions combined with fears that the U.S. central bank, and other global monetary policy makers, may need to lift interest rates to combat swelling inflationary pressures, was contributing to the market’s bearish overall tone.
On Monday, the Nasdaq Composite finished in a bear market, falling by 20% from its Nov. 19 peak and the Dow industrials notched its first correction, a decline of at least 10% (but no greater than 20%) in over two years.
— Tomi Kilgore contributed to this article.


