Who would have believed that in less than a year from China’s crypto mining ban, Bitcoin Hash Rate and mining difficulty would fully recover and reach new all-time highs?
Bitcoin mining difficulty is a measure of how difficult it is to mine a block in the network. It automatically adjusts approximately every two weeks.
While more miners join the Bitcoin network, the Bitcoin mining difficulty increases, and when miners leave the network, the Bitcoin mining difficulty decreases.
This was Satoshi Nakamoto‘s idea so the block in the Bitcoin network is mined no matter how many miners are in the network every 10 minutes.
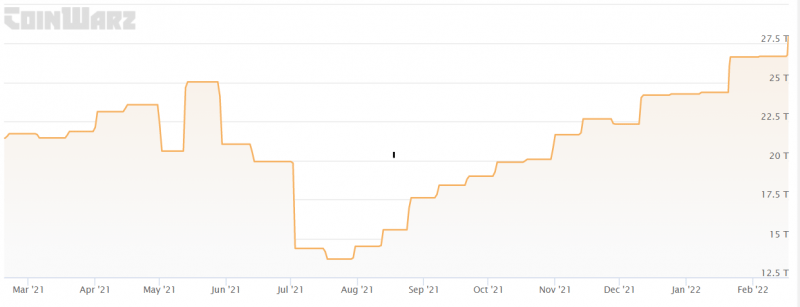
Today, on February 17, the Bitcoin mining difficulty was adjusted and reached a new all-time high of 27.96 T. This is the third time in a row it reaches a new all-time high.
Two weeks ago, on February 4, the difficulty was in 26.69 T, and on January 21 it was 26.64 T, according to CoinWarz, as you can see below:

More Miners Are Entering the Bitcoin Network
As you already know how Bitcoin mining’s difficulty works, if the difficulty reaches an all-time high, it means that more miners are joining the network.
Because of China’s ban in May 2021, many miners fled out of the country and this made both Hash Rate and mining difficulty drop. The recovery has been happening over the last months.
The previous mining difficulty all-time high before this ATH streak was on May 14 with 25.04 T. Late in July 2021, the year’s lowest mining difficulty was 13.67 T, as you can see below:
What About Bitcoin’s Price?
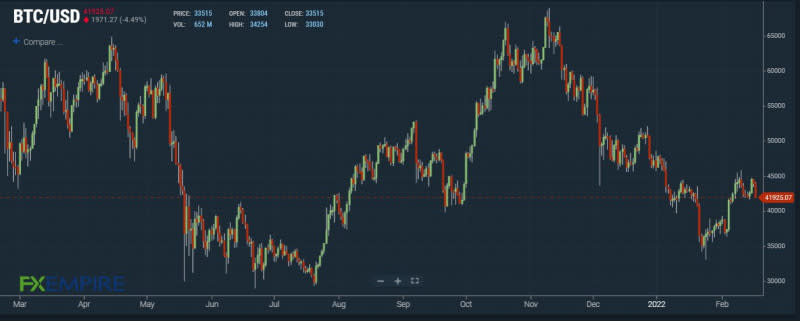
Bitcoin is trading at $41,925 and is down 3.70% in the last 24 hours. Now, let’s look at Bitcoin’s price movements over a year in the same timeframe as the mining difficulty.
As you can see, in May 2021, the BTC price dropped from $58,900 to $29,500 in late July, having a 50% drawdown. In late July, BTC started an ascending channel reaching a new ATH in November 2021 of $68,900 and then it started to decline until late January, as you can see below:
Between May and November of 2021, both mining difficulty and BTC price behaved the same way, they both fell back until late July when they started to recover.
But, since November, mining difficulty has increased and the price has decreased, this tells us that it’s not always correlated.
Since late January, we are seeing the same pattern, where BTC price and mining difficulty move up in the same way. Let’s hope more miners enter the network and the BTC price keeps moving upward.
This article was originally posted on FX Empire


