Here’s what history says about the Nasdaq Composite’s near-term returns after closing below its 200-day moving average
The Nasdaq Composite Index notched its first close below a closely watched, long-term trend line since April of 2020, and investors may be wondering how the benchmark tends to perform in the near to immediate-term after slipping below that mark.
On Tuesday, following the holiday in observance of Martin King Luther Jr. Day, the Nasdaq Composite COMP,
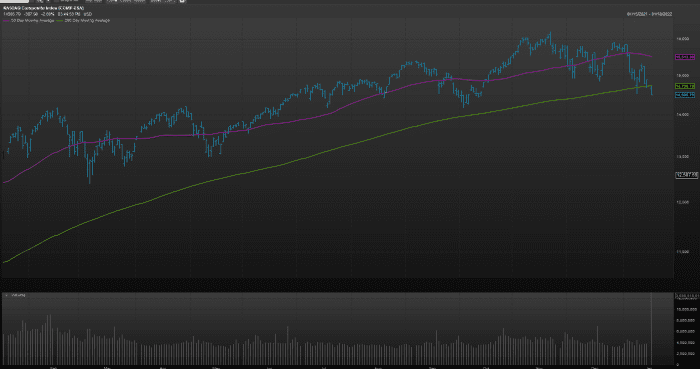
However, in the interim, the index breached another important level that market technicians view as the dividing line between bullish and bearish momentum in an asset. The Nasdaq Composite’s 200-day moving average stands at 14,730,75, FactSet data show.
The close below the 200-day trend line put an end to a streak that has lasted nearly 440 trading sessions, or well over a year.
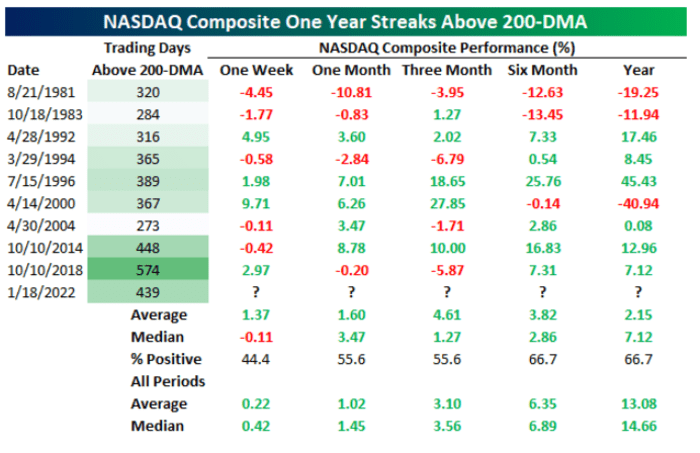
The question, however, is how does the Nasdaq Composite tend to perform once it has stumbled below the 200-day MA after a streak of at least a year, and the folks at Bespoke Investment Group have some insights.
In the short term, it isn’t good.
“Historically, one-week performance has tended to be negative following the first close below the 200-DMA with positive performance only 44% of the time and a median decline of 0.11%,” Bespoke researchers write.
But things get better over time.
“One and three months later have seen the NASDAQ rise a little better than half the time. Six to 12 months later have been positive more consistently with a move higher two-thirds of the time, but the median and average gains are smaller than the norm,” BIG writes.
Meanwhile, the Dow Jones Industrial Average DJIA,
Stocks fell sharply as Treasury yields rose in anticipation of the Federal Reserve tightening monetary policy this year. The rate-setting Federal Open Market Committee next meets on Jan. 25-26 and is likely to set the stage for a series of rate increases, and policy tightenings as it combats inflation.
With that looming, the yield on the 10-year Treasury note BX:TMUBMUSD10Y was trading around eight basis points higher Tuesday afternoon at about 1.87%, its highest level in about two years, while the 2-year Treasury note’s BX:TMUBMUSD02Y, which are more sensitive to Fed policy expectations, rate shot up 8 basis points to about 1%.
Check out: Here’s how the Federal Reserve may shrink its $8.77 trillion balance sheet to combat high inflation
Rising yields are weighing on the yield-sensitive tech stocks and growth themed areas of the market because increased borrowing costs and rates mean that investors have to discount the value of a company’s future cash flows, and that is causing a broad recalibration of tech and tech-related shares that populate the Nasdaq.
Read:Worried about a bubble? Why you should overweight U.S. equities this year, according to Goldman


