Tesla’s stock rallies again, but can’t hold gains above a key Fibonacci retracement level
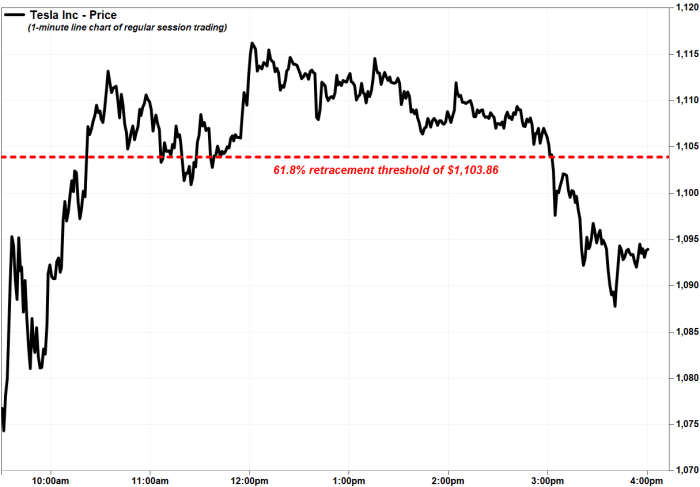
Shares of Tesla Inc. rallied Monday to a fourth-straight gain, but could not sustain the rally that carried them above a key Fibonacci retracement threshold for most of the day.
The electric vehicle giant’s stock TSLA,
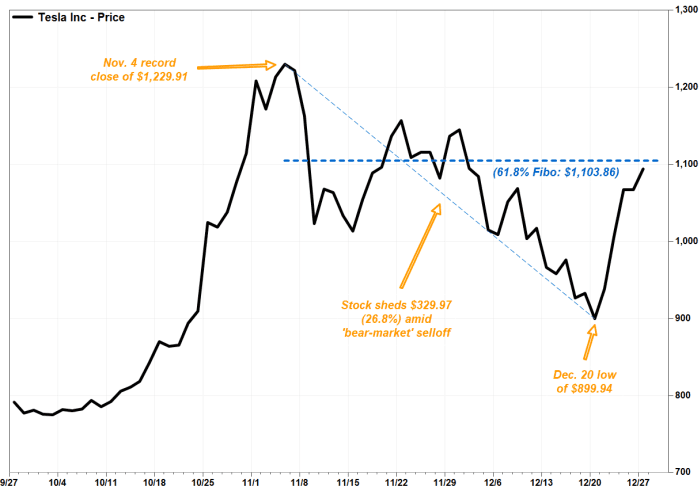
That Dec. 20 close was $329.97, or 26.8%, below the Nov. 4 record close of $1,229.91.
Also read: Tesla slides into bear market as valuation falls below $1 trillion.
Helping fuel the stock’s selloff through Dec. 20 was Chief Executive Elon Musk saying he would sell 10% of his Tesla holdings, as a large tax bill loomed, while his claim that he was “almost done” selling has helped power the stock’s recovery since then.
Don’t miss: Tesla returns to the $1 trillion club as Musk says stock sales are almost done.
Also read: Elon Musk flaunts 2021 tax tab on social media: ‘I will pay over $11 billion in taxes this year.’
In Monday trading, the stock had retraced as much as 65.8% of the Nov. 4-Dec. 20 decline at its intraday high, but ended the day with a 58.8% retracement. The late pullback in the stock could be significant to chart watchers, as it took the stock below the closely watched 61.8% retracement threshold.
That retracement threshold is based on the Fibonacci ratio of 1.618, or 0.618, which is often referred to as the golden, or divine ratio, because of its prevalence in nature, including the human anatomy, sea shells and the breeding pattern of rabbits. Made famous by a 13th-century mathematician known as Leonardo Fibonacci of Pisa, the ratio is based on a sequence of numbers, in which the sum of two sequential integers, starting at zero, equals the next highest integer (0, 1, 1, 2, 3, 5, 8, 13…).
Many chart watchers, who use a variety of technical analysis methods, have adopted the “Fibo” ratio to calculate potential support and resistance, as well as for possible take-profit and stop-loss levels. Besides 61.8%, other key Fibo retracements are 38.2% (0.618 X 0.618) and 50%.
Don’t miss: 5 charts to help unravel the Elliott Wave mystery.
For Tesla’s stock, the 61.8% retracement of the Nov. 4-to-Dec. 20 “bear-market” selloff ((1,229.91-899.94) X 0.618) + 899.94) comes in at $1,103.86. The stock had held above that level until the just after the start of the final hour of trading.
For reference, the 50% retracement was at $1064.93 and the 38.2% retracement was at $1,025.99. Some Fibo watchers also use the 76.4% retracement (0.618 X 0.382), which for Tesla’s stock would come in at $1,152.04.
Although there is no hard rule, closing below the key Fibo retracement level suggests the stock is still governed by the Nov. 4-Dec. 20 downtrend. Meanwhile, a close above $1,103.86 would suggest to some technicians that a full retracement of the downtrend becomes the next target, while others might say the stock has started a new uptrend.
Amid all of the recent volatility, Tesla’s stock has run up 55.0% this year, while the S&P 500 index SPX,
 Stock Up Recently?")


