Average earners can still afford typical U.S. homes, but comfort zone is shrinking. Here’s how to calculate home affordability.
This post originally appeared on The Basis Point: Average earners can still afford typical U.S. homes, but comfort zone is shrinking. Here’s how to calculate home affordability.
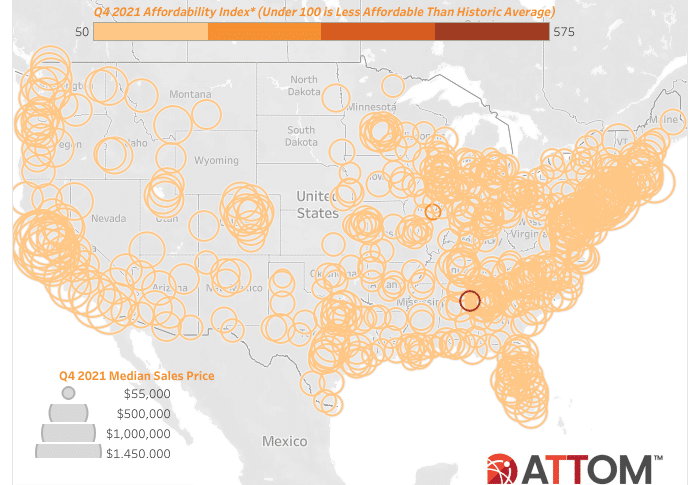
The ATTOM data team is out with their 4Q21 home affordability report, linked below. A median U.S. home price of $317,500 is still manageable but getting less affordable as prices and mortgage rates rise. Lenders use something called a debt-to-income (DTI) ratio to determine your affordability. Here’s how it works and how to calculate home affordability.
To calculate a debt-to-income (DTI) ratio, lenders divide your total monthly bills — including costs on a home you’d buy — by your total monthly income.
Lenders must follow loan approval rules made by Fannie Mae and Freddie Mac, who serve as government-sponsored supporters of the housing market.
These rules allow lenders to approve loans with DTI ratios as high as 50%, which means you’d be spending 50% of your monthly income on housing and non-housing bills each month.
This is aggressive and not everyone would choose to do this, but the government-approved rules for lenders to calculate home affordability are more flexible than alarmist headlines (including my headline above!) suggest.
So, never let a headline dictate your home buying or overall financial strategy.
Now let’s calculate home affordability in terms you can understand.
Let’s say you want to use 5% down to buy a home in your area that’s at ATTOM’s national median price of $317,500. Here’s how the monthly payment would break down today:
– Mortgage payment (3.125% rate): $1292
– Mortgage Insurance: $191
– Property Taxes: $318
– Homeowners Insurance: $100
– TOTAL MONTHLY HOUSING COST: $1901
Let’s also say you have another $800 per month in student loan, auto, and credit card payments.
This means your total monthly housing ($1901) and non-housing ($800) bills are $2701.
Let’s also assume you earn the national average annual wage shown in the ATTOM report (via BLS) of $65,546. This translates to $5462 per month.
So we divide total bills of $2701 by income of $5462 to get a debt-to-income (DTI) ratio of 49.5%.
You can see that this feels a bit high: you’d be spending half of your gross income on bills. But we know that most lenders would be able approve this as long as you had high credit scores (in the 700+ range).
The rest is for you to decide if your budget could tolerate this. Maybe you’re getting a raise soon, so you know it’s worth the stretch. These are the considerations you can make once you know the math.
THE TAKEAWAY: All home pricing is local, and how to calculate home affordability is ALWAYS based on your individual profile — not headlines.
So it’s important to get with a lender instead of letting headlines dictate your strategy. Also, hopefully these notes help you calculate home affordability yourself.
Please comment below, or reach out to me directly with questions.
___
Reference:
– Average earners can still afford typical U.S. homes, but financial comfort zone is shrinking (ATTOM)
DO YOU LIKE MONEY? GET MORE AT THE BASIS POINT®
LEGO launches new line of wooden home accessories — Next level housing disruption!
Live Blog From Top U.S. Mortgage Conference – MBA Annual 2021


