Selling losing stocks now is a smart tax move. Buying them back before January is even smarter.
You only have a couple more days to profit in two different ways from tax-loss selling.
I’m referring to the sale of stocks you’re holding at a loss in order to offset the capital gains you have previously realized so far this year, and on which you will otherwise have to pay tax this coming April.
The second opportunity to profit traces to the tendency of stocks sold in December to bounce back in the New Year. You may therefore want to get back into the stocks you sold by the end of the year.
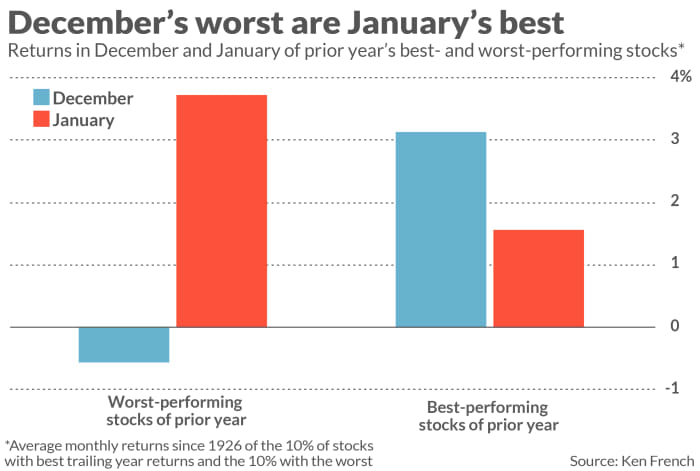
Many are not aware of this bounce back tendency, and so therefore miss out on the second half of this two-pronged year-end strategy. But it’s quite pronounced, as you can see from the chart below, which reports the average monthly returns in December and January of the trailing year’s worst- and best-performing stocks. To put losing stocks’ rebound in context, consider that on an annualized basis they produce the equivalent of a 55% gain in January.
There’s a catch: The IRS disallows your tax losses if, within 30 days you repurchase the stocks you have sold. It’s because of this so-called wash sale rule that you don’t have much time left this year to sell the stocks you’re holding with a loss and repurchase them by the end of December. If you instead wait until mid- or late-December to harvest your tax losses, you may miss out on the bulk of your stocks’ potential January rebound.
What if you don’t want spend December out of the stocks you’d otherwise consider selling for tax-loss purposes? The only solution I know of is to find other securities that are highly correlated with them, and to substitute these new ones during the 30-day wash-sale period. To the extent your substitutes perform as well as your original holdings, you won’t be missing out on any gains while nevertheless being able to harvest tax losses.
To illustrate, consider Exxon Mobil XOM,
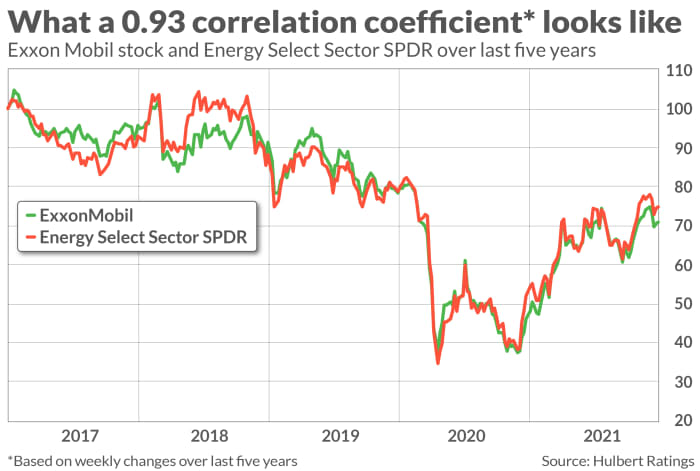
You won’t always be able to find a security that is as highly correlated as Energy Select Sector SPDR is to Exxon Mobil, but your goal should be to find one with a correlation coefficient of 0.7 of higher. From a statistical point of view, that means you’re finding a security whose gyrations can explain or predict at least half of the movements of your tax loss sale candidate.
Several online tools locate substitute securities that are highly correlated with your tax-loss-sale candidates. For the visually-minded among you, go to the “Advanced Charting” tab that is provided on the MarketWatch website for any stock. By inputting another ticker in the “Compare” box you can see a price chart of the two securities and how closely they are correlated.
The more statistically-minded among you can use tools such as the “Correlation Tracker” available at the Select Sector SPDR website and the “Assets Correlation” tool at the Portfolio Visualizer website.
But get going. You don’t have a moment to lose.
Mark Hulbert is a regular contributor to MarketWatch. His Hulbert Ratings tracks investment newsletters that pay a flat fee to be audited. He can be reached at [email protected]
More: Is investing in foreign stocks a good idea?
Plus: Buying stocks with borrowed money isn’t as crazy as it sounds


