‘Death cross’ in 10-year Treasury yields signals that bond yields may plumb new depths and prices rally
A death cross in the benchmark 10-year Treasury note yield was taking shape Wednesday, forming a pattern in charts that point to the possibility of fresh lows for rates in the government debt used to price everything from mortgages to car loans.
The so-called death cross in the 10-year note TMUBMUSD10Y,
Read: 10 and 30-year Treasury yields are caught in a ‘death cross’
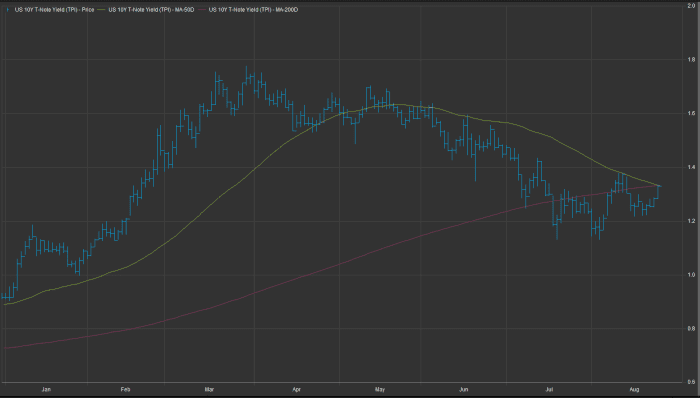
The point where the 50-day moving average crosses below the 200-day MA is usually referred to by technical analysts as a “death cross,” with such breaches seen as the spot where a shorter-term pullback evolves into a longer-term downtrend.
In this case, the 10-year Treasury sits at around 1.321% on a nominal basis, but its 50-day moving average was at 1.332%, according to FactSet data, while the 200-day longer-term MA is at 1.335%.
A breach of the 50-day yield trend below the 200-day may also come counter to the notion that rates should be rising, while the Dow Jones Industrial Average DJIA,
Technical analyst Mark Newton, managing director at Newton Advisors, told MarketWatch that the death cross forming could be taken with a grain of salt.
“Moving averages illustrate larger trends at work, and yes a 50-day crossing a 200-day speaks to the degree of weakness in yields,” he said.
“As to the predictive ability it can be rather a coin flip, but typically does coincide with further weakness, in this case, yields going lower,” he said.
“This is not something 95% of technicians ever look at, or at least myself and any of my peers, as being any kind of a reliable predictor,” he added.
Still, the death cross in yields highlights the seemingly paradoxical movements of Treasury rates during a period in which mounting evidence of hotter-than-expected inflation, an anathema to a bond’s fixed value, should be driving yields higher not lower.
Frank Cappelleri, a desk strategist at Instinet told MarketWatch that quizzical behavior of yields this year against the backdrop of expectations of eventual tapering of asset purchases by the Federal Reserve and rising price pressures is worth monitoring.
“It’s an interesting development for sure, given the consistent advance in yields through this past spring and the about-face since then,” he said of the death cross.
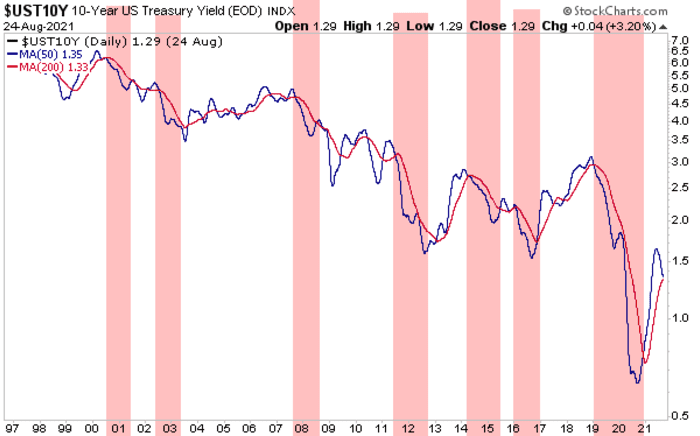
The Instinet executive said that death cross periods, where the 50-day slides beneath the 200-day yield, have tended to be fairly good predictors of further downside in yields. The attached chart plots ONLY the 50-day (blue) and 200 MA (red) over the past two decades.
Chartists also like to point out that death crosses, and the inverse golden cross, tend to affirm rather than predict patterns in the market.
Cappelleri said that could be the case this time too. He said an important development to watch would be if the 50-day moving average were to remain below the 200-day for an extended period. “If it does, it could be a sign that rates have more downside,” he said.
Squarely front of mind for investors this week is the Jackson Hole economic symposium, where some analysts think the Fed will announce the start of a pullback on its monthly purchases of $120 billion in Treasurys and mortgage-backed bonds purchases, and that a taper of the program will run at a $15 billion pace at each central bank meeting.
However, there are growing doubts whether Fed Chairman Jerome Powell will provide deep insights on Friday into tapering plans or even mention a reduction of Fed accommodation, in light of concerns about the spread of the delta variant of COVID-19.


