CHAPEL HILL, N.C. (MarketWatch)—The real cause of the air pocket the stock market hit this week was excessive bullishness.
That’s not the prevailing narrative, of course. The almost universal blame is being put on the Federal Reserve’s rate-setting committee for accelerating its road map for raising rates.
Yet that acceleration does not, in and of itself, justify a significant revaluation of equities’ value—a revaluation that took nearly 400 points off the Dow Jones Industrial Average DJIA,
In fact, the present value of stocks’ expected future earnings and dividends barely changed after the Fed’s meeting. Both before and after that meeting, the median expectation of members of the Fed’s interest-rate-setting committee has been that the federal funds rate would rise to 2.5% when economic conditions returned to normal. The sole thing that changed was whether that increase would begin no earlier than 2024, which was the prior expectation, or instead start in 2023—with the fed funds rate rising modestly to just 0.50% by year’s end.
Be my guest calculating the impact that single change has on the present expected value of the stream of a stock’s future earnings and dividends. John Graham, a finance professor at Duke University’s Fuqua School of Business, said in an interview that it’s “minimal.”
I submit that the real culprit behind Wednesday’s selloff was the excessive bullishness that prevailed before the meeting. When there’s too much optimism, even the slightest provocation can cause significant disappointment. To explain the market’s reaction, therefore, we must turn to contrarian analysis rather than fundamental analysis.
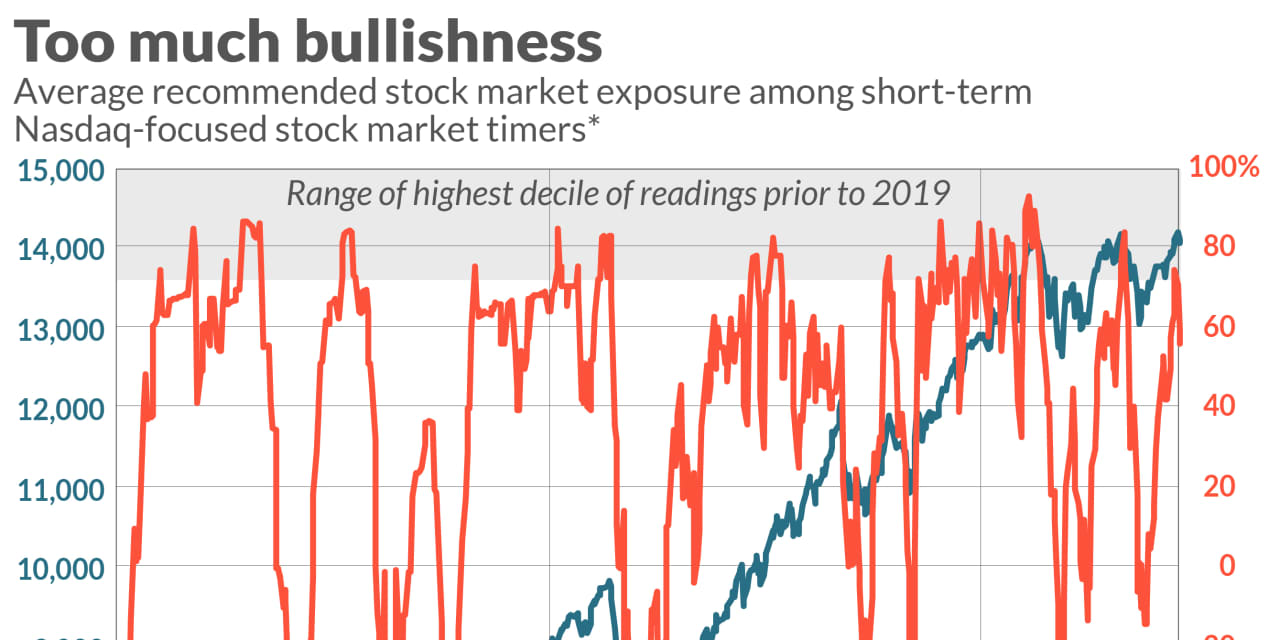
Consider how bullish the several dozen Nasdaq-focused COMP,
The good news is that, in the wake of the stock market’s midweek drop, the market timers began to quickly retreat from their erstwhile bullishness. To the extent they continue their retreat, odds increase that the market’s decline will be modest and short-lived. A strong contrarian trading buy signal will come when the HNNSI drops into the lower gray zone on the chart—representing the lowest 10% of the historical distribution.
As you can see from the chart, however, the last time that happened was at the bottom of the market’s waterfall decline in March of last year. Since then the market timers on balance became only moderately bearish as the market declined, and instead were quick to turn bullish again when the market showed any sign of strength.
As I argued in a column at the beginning of this month, this behavior points to a trading-range market—in which both rallies and declines are subdued. What we’ve seen since then suggests this trading range will continue for at least a while longer.
Mark Hulbert is a regular contributor to MarketWatch. His Hulbert Ratings tracks investment newsletters that pay a flat fee to be audited. He can be reached at [email protected]
More on the markets:
Don’t get too optimistic about a stock market rally—they’ve been fizzling out
Fed, alert to risks of higher inflation, now sees two interest rate hikes in 2023


