Wall Street’s finest are so bullish on stocks that a contrarian sentiment gauge is on the verge of sending a sell signal.
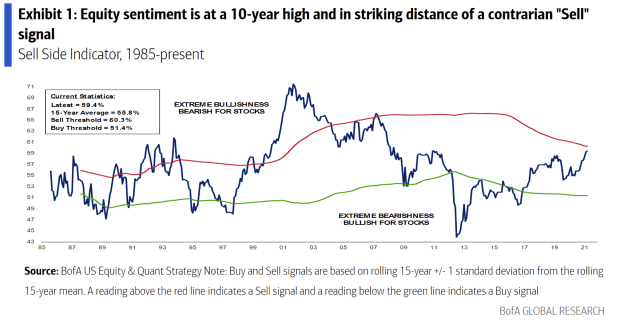
BofA analysts led by Savita Subramanian said in a Thursday note that the bank’s Sell Side Indicator, which tracks the average recommended equity allocation by Wall Street’s sell-side strategists, rose for a third straight month in March to hit 59.4%, up from 59.2% in February.
That puts the indicator at a 10-year high and less than a point away from a contrarian “sell” signal, its closest since May 2007, when the S&P 500 index SPX,
Investors and analysts pay close attention to a range of sentiment measures. Extreme bullish or bearish readings are often viewed as contrarian signals that markets are due for a either a bounce or a pullback.
The S&P 500 on Thursday pushed above the 4,000 milestone for the first time, while the Dow Jones Industrial Average DJIA,
“Increasingly euphoric sentiment is a key reason for our neutral outlook as the cyclical rebound, vaccine, stimulus, etc. is largely priced into the market,” the analysts wrote. Stocks have rebounded sharply after plunging into a bear market that bottomed out last March as the pandemic began to take hold.
The analysts noted that since last March, the average recommended equity allocation has risen by over three times the typical rate. It’s up 450 basis points, or 4.5 percentage points, over the last 12 months versus the average of 138 basis points following previous bear markets.
“We’ve found Wall Street’s bullishness to be a reliable contrarian indicator,” they wrote.
For now, the indicator remains in “neutral” territory. What does that mean for returns?
The analysts noted that when the indicator has been at or below its current level, subsequent 12-month returns have been positive 89% of the time. While that’s encouraging, they observed that the current reading of the indicator is in line with 12-month returns of just 6%, well below the average 12-month forecast of 14% since the end of the 2008 global financial crisis, adding the standard caveat that past performance isn’t an indication of future results.
The analysts said investors would be best served by focusing on areas sensitive to the real economy, including cyclical and value stocks, capital-expenditure beneficiaries and small-caps as President Joe Biden attempts to push through his $2 trillion infrastructure spending plan.
“But it’s not all blue skies. The market appears to already be pricing in additional stimulus and the focus is shifting to paying it back (i.e., higher taxes),” they warned. “Valuations today are signaling anemic long-term returns and rising rates are also a headwind for both income investors, who have piled into equities amid low rates, and corporate margins.”
They also see room for volatility to pick up in the second half of the year. That said, “staying invested is an underappreciated way to avoid losses,” they wrote, favoring a focus on fundamental factors over attempting to time the market via momentum and positioning factors. A focus on quality stocks, which are “cheap and neglected” can also provide a hedge against volatility, they said.


